Chapter 3 Using DaSEH Materials 
3.1 Learning Objectives
This chapter will provide guidance on how to use DaSEH resources for instruction including how to:
- Determine prerequisite knowledge and skills
- Identify what material is appropriate for beginner, intermediate, or advanced learners
- Use the full set of DaSEH resources, some of the modules, or just the data for different kinds of instruction
- Extend the materials to serve as a template for homework assignments or independent student exploration
The examples presented in this chapter are merely suggestions. Modifications to the material to fit student needs are expected and encouraged! If you come up with a different way to use our resources, please let us know what you come up with so that other educators may be inspired by your creativity.
Under our CC BY-NC-SA license, you should indicate that you are using our resources or a modified version of our resources.
3.1.1 Prerequisites
The following are suggested for students using DaSEH materials.
3.1.1.1 Environmental Health Subject Matter
DaSEH uses data related to environmental health. There is no requirement for any prior knowledge on environmental health. DaSEH resources are also applicable for those interested in data science for other uses.
3.1.1.2 Statistics
DaSEH materials expect some familiarity with statistics and focuses mostly on the application of R for analysis, rather than the theory of statistics. We recommend additional resources for statistics if you are teaching a statistics course. Alternatively, you may choose to omit the Statistics module.
3.1.1.3 Coding/Data Science
All DaSEH materials use the R statistical programming language for data analysis. No familiarity with R basics is expected for learners.
3.1.1.4 Software
DaSEH uses R and RStudio. The most recent versions tested out for DaSEH can be found here.
3.1.2 Experience Level Descriptions
The table below explains how we define the beginner, intermediate, and advanced experience levels.
| Experience Level | Description |
|---|---|
| Beginner | Little to no previous experience with coding and/or statistical analysis. |
| Intermediate | Familiar with at least one programming language and has experience working with data and statistics. |
| Advanced | Fluent in at least one programming language and likely familiar with more. Has a depth of experience working with data science projects. |
Typically, most middle/high school and first year undergraduate students will fit in the beginner category. Upperclassmen undergraduates and some graduate students are often at the intermediate level. Most advanced level students will be at the graduate level. However, this is a generalization, and a student may be considered beginner, intermediate, or advanced at any academic level depending on their independent studies and experiences.
3.2 DaSEH in the Classroom
The DaSEH materials are structured in a modular manner to support both partial and full use of our materials. Educators are also free to use the DaSEH data by itself.
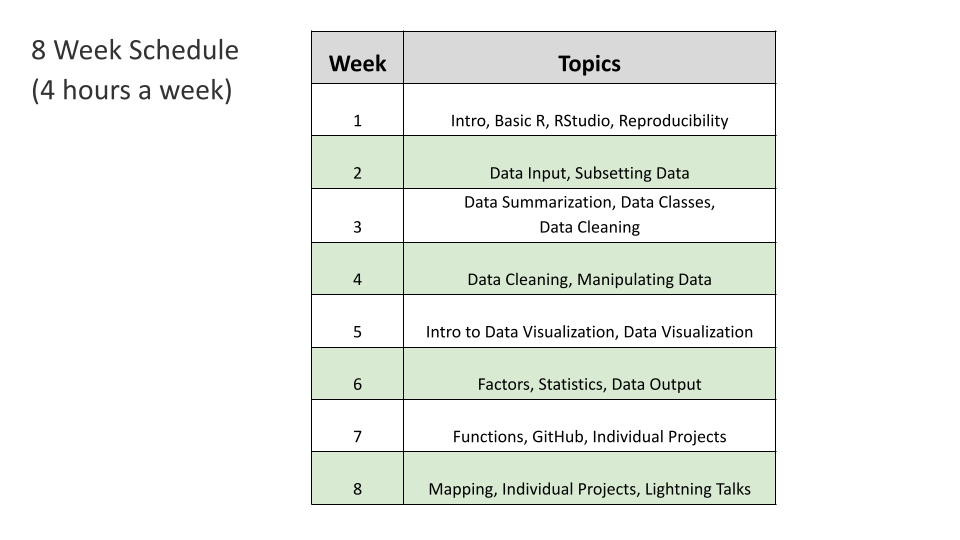
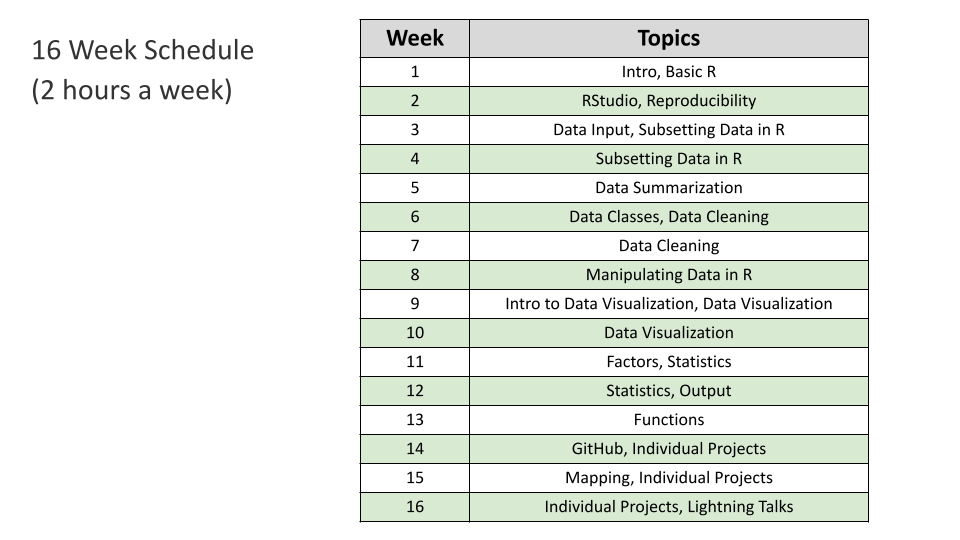
3.2.1 Teaching DaSEH - Full Set of Materials
The DaSEH materials are written to provide a comprehensive introduction to environmental health data science. Our materials provide students with experience in all the standard aspects of a data science workflow as well as best practices regarding reproducibility. The following list provides a few examples of how educators could use the materials:
- Use our full set of slides as lecture and materials as we have used them
- Do a flipped classroom approach and assigned students to read the slides as homework and do labs in the class together
- Assign students to extend analysis beyond what is shown in our lecture or lab materials to dive deeper or provide more homework
3.2.2 Teaching DaSEH - Part of the Materials
Depending on the course objectives, instructors might choose a subset of modules. Note that some introduction/explanation might be needed for any functions that were explained in a previous module. The following are a few examples of how our modules could be used:
3.2.2.1 Data Visualization Focus
The following modules could be useful:
- Basic R (only if students don’t have familiarity with R)
- RStudio (only if students don’t have familiarity with R)
- Manipulating Data in R (to convert data from wide to long format to facilitate data visualization)
- Intro to Data Visualization
- Data Visualization
- Factors
3.2.2.2 Data Wrangling Focus
The following modules could be useful:
- Basic R
- RStudio (only if students don’t have familiarity with R)
- Subsetting Data in R
- Data Classes
- Data Cleaning
- Manipulating Data in R
- Factors
3.2.3 Teaching DaSEH - Data Only
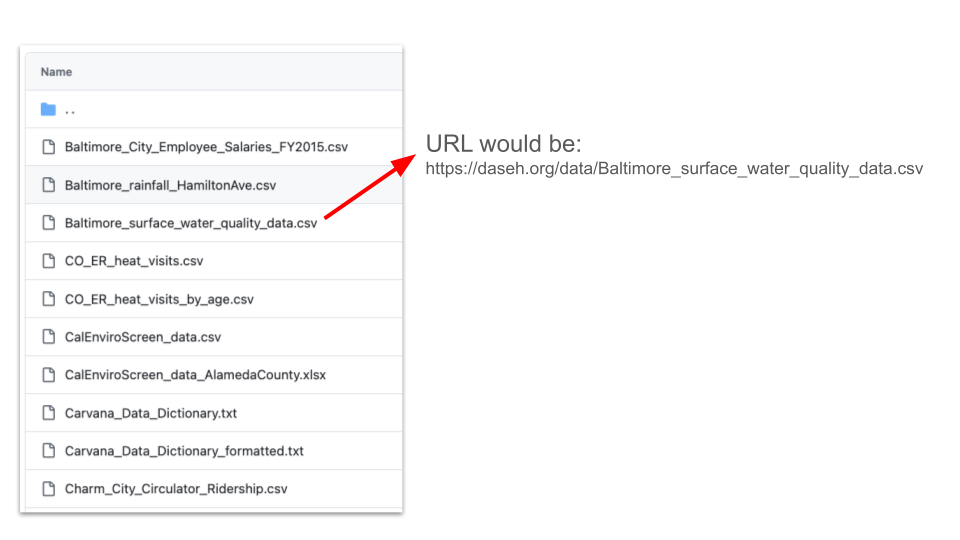
Educators can use DaSEH’s data without using the DaSEH materials as a whole. The data is available on GitHub in the data directory and the data page of the website. See the data section of the infrastructure chapter for more information about how to access the data.
The data can also be accessed directly in R via URL, replacing filename.csv with the name of the data file in the following pattern:
"https://daseh.org/data/filename.csv"For example:
# readr package is required for read_csv()
library(readr)

er <- read_csv("https://daseh.org/data/CO_ER_heat_visits.csv")

er_visits_age <- read_csv("https://daseh.org/data/CO_ER_heat_visits_by_age.csv")

Denver_heat_Data.csv <- ("https://daseh.org/data/Denver_heat_data.csv")
Be careful to make sure that the name of the file matches exactly include the case of the letters:
A table of which module(s) data is used in is available here: https://daseh.org/data.html
A paper about how to consider what data to use for teaching may also be useful to read called: How to be “Choosy”: Wrangling big datasets for the classroom (pdf can be found here).
3.3 DaSEH Level Recommendations
Overall the DaSEH materials are intended for anyone with zero to minimal familiarity with R, although we have had learners with more intermediate levels of experience who have reported getting a lot out of the material.
Across the program, the modules also involve different levels of skill, as some would be fine on their own for beginners, while others may require some basic familiarity. Below we provide broad categorizations of each module in terms of the skill levels required (beginner, intermediate, or advanced).
Here, we are using the following interpretations of “beginner”, “intermediate”, and “advanced”:
| Level | Skills |
|---|---|
| Beginner | No experience with importing data into any programming language. No experience wrangling and cleaning raw data in any programming language. No experience visualizing data in any programming language. No experience with statistical concepts. |
| Intermediate | Some experience with importing common data formats (e.g. CSVs) into R or significant experience in another programming language. Some experience wrangling or cleaning raw data in common formats (e.g. numerical data) in R or significant experience in another programming language. Some experience with common visualization packages in R (e.g. ggplot) or significant experience in another programming language. Some familiarity with common statistical concepts (e.g. summary statistics, hypothesis testing) and techniques (e.g. t-test). |
| Advanced | Experience with importing uncommon data types (e.g. PDFs or web-scraping) and comfort with troubleshooting import challenges. Experience cleaning and wrangling raw data in uncommon formats (e.g. regular expressions) in R and comfort with troubleshooting wrangling challenges. Experience with creating complex data visualizations in R and comfort with visualization challenges.Good understanding of foundational statistical concepts and comfort with applying foundational statistical techniques. |
The following table lists a few example case studies that would be suitable for each experience level.
| Module | Skill Level |
|---|---|
| Intro | Beginner |
| Basic R | Beginner |
| RStudio | Beginner |
| Reproducibility | Beginner but also appropriate for Intermediate or Advanced audiences that are new to this topic |
| Data Input | Beginner |
| Subsetting Data in R | Intermediate |
| Data Summarization | Intermediate |
| Data Classes | Beginner |
| Data Cleaning | Intermediate |
| Manipulating Data in R | Intermediate |
| Intro to Data Visualization | Beginner |
| Data Visualization | Intermediate |
| Factors | Intermediate |
| Statistics | Beginner * Note that we do not focus on statistical theory, but rather on using R to perform tests |
| Data Output | Beginner |
| Functions | Intermediate and Advanced if a new topic |
| Version Control (codeathon resource) | Intermediate and Advanced if a new topic |
| Open Data | Beginner |
| Code Review | All levels if new topic |
| Data Ethics | All levels |
| Mapping mini-module | Intermediate |
3.4 Troubleshooting
You may encounter errors trying to render our materials from the .Rmd files.
R packages versions can have updates to arguments and function names that can cause code to work differently or can break the code.
If you encounter an error, this is likely the reason. We try to update our materials when we can, but updates to packages may happen in the meantime. We recommend using the knit-to-Rmd error messages to determine what function(s) may have been updated or deprecated. This helps you or your students learn the most up-to-date information.
3.5 Additional Use Cases
Our materials can be used in a variety of ways that cater to the learner’s goals, experience, and interests. Below, we provide a few examples of how they could be used. If you use DaSEH resources in a new way, please let us know about it!
3.5.1 Using Materials for Assignments
Assignments could include:
Scientific writing like writing scientific journal sections (e.g. Introduction, Methods, Results, Discussion) based on the the data and analysis
Extending analyses based on results presented in the lectures and labs
Using data in the Predictability, Computability, and Stability (PCS) framework to think critically about real-world data challenges
Additional data visualization
Presentations
Our final project guidelines could also be expanded to create a more involved project.
3.5.2 Independent Study
Our materials and recordings can be used to help learners to gain experience in statistics and data science independently. We strongly recommend that independent learners aim to actively engage with the recordings by running the analyses independently, and exploring additional data to investigate their own hypotheses. Furthermore, creating a finished product, such as a blog post or a presentation, can be an excellent demonstration of the skills learned.
3.6 Additional Resources
3.6.1 Resources for Data Science and Writing
Considerations for effective and ethical data visualization
Advanced Data Science Course taught by Jeff leek and Roger Peng at Johns Hopkins Bloomberg School of Public Health.
Resource on writing and evaluating scientific writing.
3.6.2 Resources for GitHub, Code Review, and Reproducibility:
Guide to code review
Advanced Reproducibility course (this includes more information about how to create a pull request and how to do code review)
3.7 Session info
## R version 4.3.2 (2023-10-31)
## Platform: x86_64-pc-linux-gnu (64-bit)
## Running under: Ubuntu 22.04.4 LTS
##
## Matrix products: default
## BLAS:   /usr/lib/x86_64-linux-gnu/openblas-pthread/libblas.so.3
## LAPACK: /usr/lib/x86_64-linux-gnu/openblas-pthread/libopenblasp-r0.3.20.so;  LAPACK version 3.10.0
##
## locale:
##  [1] LC_CTYPE=en_US.UTF-8       LC_NUMERIC=C
##  [3] LC_TIME=en_US.UTF-8        LC_COLLATE=en_US.UTF-8
##  [5] LC_MONETARY=en_US.UTF-8    LC_MESSAGES=en_US.UTF-8
##  [7] LC_PAPER=en_US.UTF-8       LC_NAME=C
##  [9] LC_ADDRESS=C               LC_TELEPHONE=C
## [11] LC_MEASUREMENT=en_US.UTF-8 LC_IDENTIFICATION=C
##
## time zone: Etc/UTC
## tzcode source: system (glibc)
##
## attached base packages:
## [1] stats     graphics  grDevices utils     datasets  methods   base
##
## loaded via a namespace (and not attached):
##  [1] jsonlite_2.0.0   dplyr_1.1.4      compiler_4.3.2   gitcreds_0.1.2
##  [5] promises_1.2.1   tidyselect_1.2.0 Rcpp_1.0.12      webshot2_0.1.2
##  [9] xml2_1.5.1       stringr_1.5.1    tidyr_1.3.1      later_1.3.2
## [13] jquerylib_0.1.4  yaml_2.3.12      fastmap_1.1.1    readr_2.1.5
## [17] R6_2.6.1         generics_0.1.3   curl_7.0.0       knitr_1.50
## [21] tibble_3.3.0     bookdown_0.46    rprojroot_2.1.1  tzdb_0.4.0
## [25] bslib_0.6.1      pillar_1.9.0     rlang_1.1.6      utf8_1.2.4
## [29] websocket_1.4.4  stringi_1.8.3    cachem_1.0.8     xfun_0.55
## [33] sass_0.4.8       cli_3.6.5        magrittr_2.0.3   ps_1.9.1
## [37] digest_0.6.34    rvest_1.0.5      processx_3.8.6   hms_1.1.3
## [41] lifecycle_1.0.4  chromote_0.5.1   vctrs_0.6.5      ottrpal_2.0.0
## [45] evaluate_1.0.5   glue_1.7.0       spelling_2.3.2   fansi_1.0.6
## [49] purrr_1.0.2      rmarkdown_2.25   httr_1.4.7       tools_4.3.2
## [53] pkgconfig_2.0.3  htmltools_0.5.7
This work is licensed under a Creative Commons Attribution-NonCommercial-ShareAlike 4.0 International License.
![]() DaSEH is funded by the National Institute of Environmental Health Sciences 1R25ES035590-01.
DaSEH is funded by the National Institute of Environmental Health Sciences 1R25ES035590-01.