Chapter 1 Introduction 
1.1 Learning Objectives
In this chapter we will:
- Describe the audience for this guide
- Discuss what you can expect in this guide
- Introduce the Data Science for Environmental Health Short Course (DaSEH)
- Introduce the resources that make up this project
1.2 Motivation
The Data Science for Environmental Health Short Course (DaSEH), developed at the Fred Hutch Data Science Lab, is a NIH Short Course program that provides open-source teaching materials for introductory environmental health data analyses in R. The intention of this guide is to provide instructors more information about how to make the most of our resources.
1.3 Reuse and Licensing

All of our materials are licensed with CC-BY-NC-SA 4.0.
This means you are free to:
- Share — copy and redistribute the material in any medium or format
- Adapt — remix, transform, and build upon the material
Under the following terms:
- Attribution — You must give appropriate credit, provide a link to the license, and indicate if changes were made. You may do so in any reasonable manner, but not in any way that suggests the licensor endorses you or your use.
- NonCommercial — You may not use the material for commercial purposes.
- ShareAlike — If you remix, transform, or build upon the material, you must distribute your contributions under the same license as the original.
1.4 Target Audience
This guide is intended for educators who are interested in using DaSEH materials for instruction.
Elements of our materials can be helpful for instructors who teach:
- High school students
- Undergraduate students
- Graduate students
- Professionals (researchers and public health practitioners)
And can be applied to courses or materials in:
- Environmental Health
- Data science
- Statistics
- Public health
- Programming
- Technical writing
… and more
1.5 Curriculum
This guide documents:
- The DaSEH philosophy
- The general structure of the short course
- Various entry points to using the short course materials (including our hands-on lab exercises, homework ideas, and more)
- Examples of how to use the materials in the classroom
- Instructions on how to modify/adapt our materials
- Guidelines for contributing to our materials or creating your own short course
1.6 DaSEH Philosophy
The DaSEH short course is an educational resource that educators can use for environmental health data science education. Our goal is teaching students how gain insights from data in real-world challenges about environmental health.
Most of DaSEH’s examples use real environmental health data from public sources in an effort to make the material more engaging and relevant.
Our materials focus on the decision making process of real data analyses, basic challenges of analyses, applications of data methods, and context for when to use different approaches. We emphasize best practices for mindful data cleaning, reproducibility, and science communication.
We also focus on troubleshooting and looking up documentation to support continued learning, rather than memorization of small coding details. For more information on our teaching philosophy see our paper about teaching R.
All DaSEH materials are open source and available at our GitHub Repository. We provide transparency about data sources and, where possible, how it was produced. We also cover data limitations and ethical considerations.
Our materials are modular and flexible enough for standalone/bonus assignments or full classroom use.
We hope you find our resources useful!
1.6.1 What problem are we addressing?
Despite a growing interest in data science and environmental health, instructors do not always have time to create related materials. These resources are intended to support instructors who want to bring environmental health data science education to their students. Ultimately, this will facilitate more research and scientific breakthroughs in this important field of public health.
1.7 DaSEH Short Course Resources
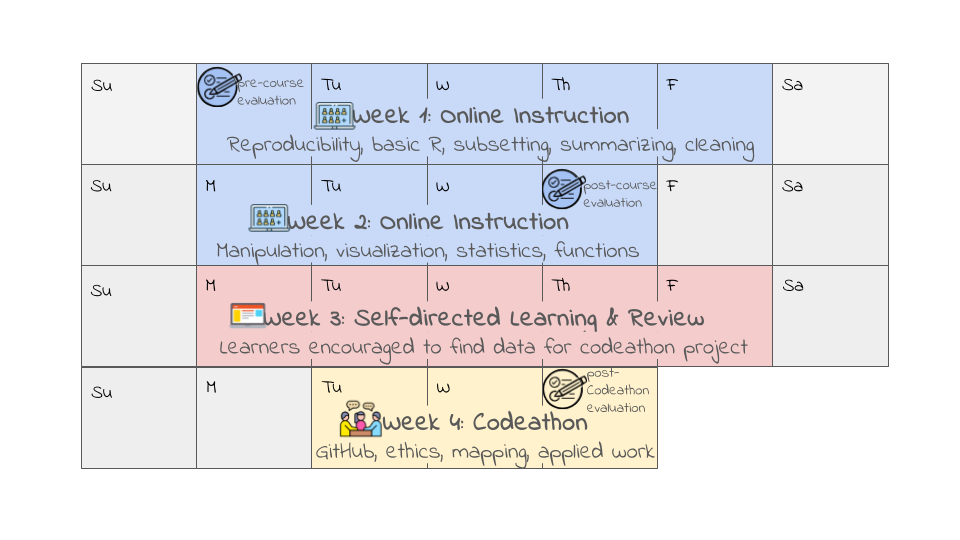
The DaSEH Short Course has 3 main stages: online instruction, self-directed learning, and the codeathon.
1.7.1 Stage 1: Online Instruction
In the first stage, learners participate in a synchronous online course where they watch didactic lectures and live demos on a particular topic, followed by hands-on lab activities.
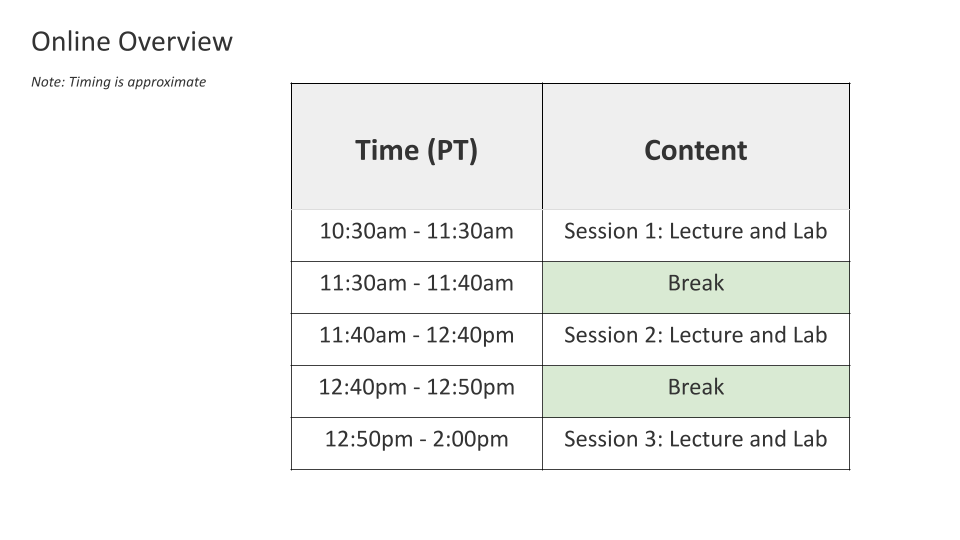
Course instruction lasts for 9 days, with 3.5 hours each day. Each day includes breaks between sessions (breakdown shown below). Each day’s sessions cover one or two modules, described below.
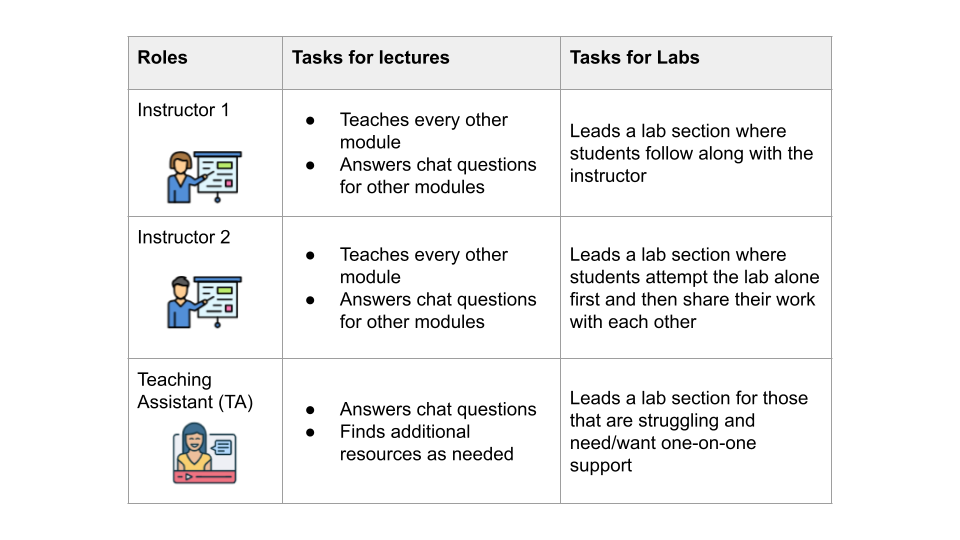
We recommend having two instructors and one TA. We have the instructors split up the module lectures for the following reasons:
- to reduce instruction burden
- to allow learners to ask questions via chat during the course without disruption
- to provide learners with slightly different teaching styles/explanations among instructors
For labs, we provide learners with 3 options via Zoom Breakout Rooms:
- Room 1: Instructor waits briefly for each question and then walks through the exercises with learners.
- Room 2: Instructor allows learners time to work through all exercises. Students then share their work and challenges with guidance and troubleshooting from the instructor.
- Room 3: A room where the teaching assistant helps those who need one-on-one support.
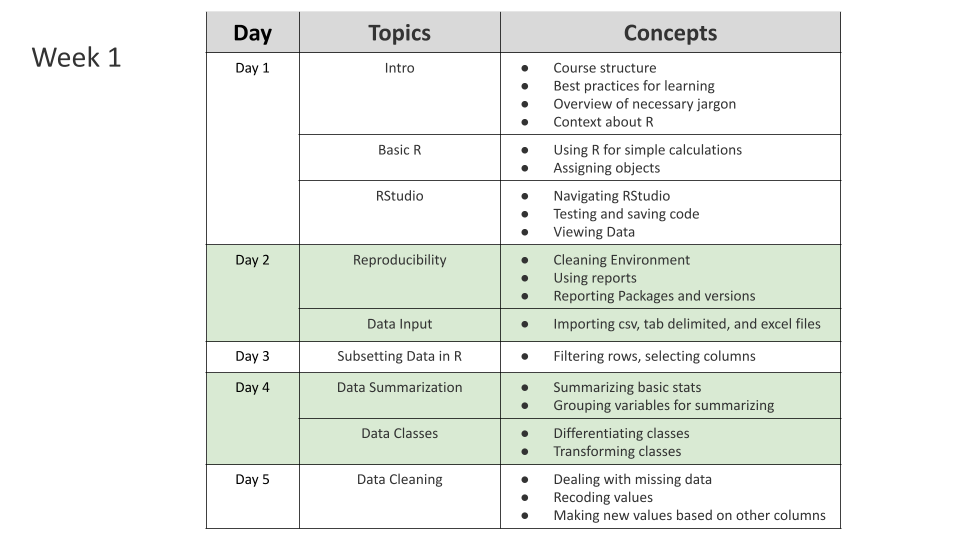
Our modules cover the following topics:
Week one:
- Reproducibility
- Basic R
- Subsetting Data
- Summarizing Data
- Cleaning Data
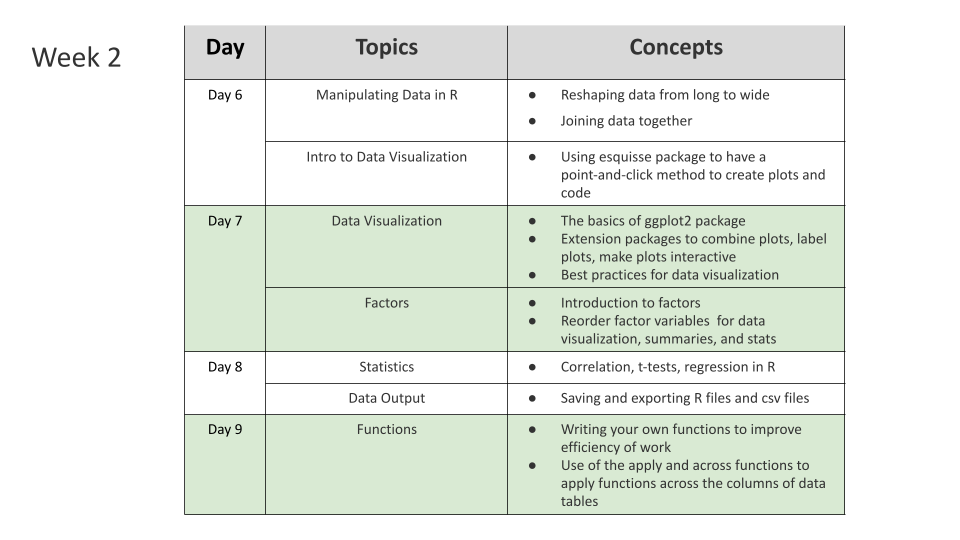
Week two:
- Manipulation Data
- Visualization of Data
- Statistics
- Functions
Students have access to our website for course resources which includes lecture slides, lab exercises, cheatsheets to remind them about important functions, homework assignments, and additional resources.
1.7.2 Stage 2: Self-Directed Review and Project Planning
In this stage, learners can complete homework problems for extra practice, rewatch lecture and lab recordings, and catch up on other responsibilities before the codeathon (Stage 3). This stage lasts at least a week, giving learners time to digest and consolidate what they’ve learned.
Learners are also encouraged to find public data or bring their own, so that they can identify a research question for their project in the codeathon stage. Learners are provided with an example project and a template R Markdown file.
1.7.3 Stage 3: Codeathon
In the final stage of the short course, learners participate in a 3 day codeathon to apply what they learned. Learners choose a topic of interest, get in person assistance from peers and instructors, ask more in-depth questions, and learn about some more advanced topics in reproducibility and data ethics.
See this codeathon schedule for more details.
1.8 Getting Started
DaSEH materials are designed to be beginner friendly. Learners can work through our materials with no prerequisite knowledge in programming, environmental health, public health, or statistics. However, the appropriate technology, software, and a basic familiarity with R Studio is helpful. This section will detail what learners and instructors will need.
1.8.1 Technical Requirements
Our materials use the R statistical programming language for data analysis. R is available for Windows, Mac, and Linux and can be downloaded from the The Comprehensive R Archive Network (CRAN). While there is no specific R version requirement, we recommend that instructors have all learners use the same version (typically the most recent version of R).
Additional R packages are also required, including:
tidyversenaniarjanitoresquisse
Cheatsheets detailing how to use common packages and functions are available at the RStudio website.
Please note that to install R version 3.5 and higher you will need to have a web browser and a compatible operating system. See this link for more information.
1.8.2 RStudio
To work with R, we recommend the RStudio Integrated Development Environment. RStudio includes a console, syntax-highlighting editor that supports direct code execution, as well as tools for plotting, history, debugging and workspace management. RStudio is available in open source and commercial editions and runs on the desktop (Windows, Mac, and Linux) or in a browser connected to RStudio Server. More information and program installation instruction are available at the RStudio website.
For reproducible data analyses and easy publishing of reports and presentations, we recommend using RMarkdown. More information about RMarkdown is also available at the RStudio website.
RStudio is one of the most widely used development environments among R programmers. Other options can be explored here.
1.8.3 GitHub
DaSEH is hosted on GitHub. GitHub is a website and cloud service that enables developers to store, manage, and track changes to their code. DaSEH uses GitHub for both development and distribution purposes. Users have complete access to all materials through our DaSEH GitHub repository. The repository contains all the materials needed for the course. We use this same repository to host our website for free via GitHub Pages.
The DaSEH GitHub repository includes:
- Slides (in multiple formats)
- Data used in the examples (that aren’t installed in R otherwise)
- Cheatsheets to remind learners of packages
- homework and lab files, including both keys and raw files
While experience with GitHub is not needed to access the materials, using GitHub can streamline downloading, modifying, and collaborating with us on our resources. An introduction on how to get started with GitHub is available at Happy Git.
1.9 Website Map
The DaSEH website has several relevant pages:
Home: explains what the course is for: https://daseh.org/index.html
Apply: links to a form to apply to DaSEH – The link to Google Forms changes periodically, but you can view a static version here
Course Content
- Materials + Schedule: A schedule with all associated materials: https://daseh.org/materials_schedule.html
- Course Logistics: information about how people can participate and what is required: https://daseh.org/logistics.html
- Data: links to data used in the course and resources about where to find environmental health data: https://daseh.org/data.html
- Error FAQ: help page for common issues, common errors, and how to change preferences in RStudio: https://daseh.org/help.html
Support
- Learning Resources: links to extra learning and help: https://daseh.org/resources.html
- Contact Us: https://daseh.org/contact.html
- Give Feedback: (Link to Google Forms changes periodically)
Instructors
- Instructor Workshops: Upcoming events: https://daseh.org/instructors.html
- Instructor Guide: This resource!
1.10 Feedback
We are continually working to improve the DaSEH resources to address learner and educator needs. Feedback is essential for this goal. If you use DaSEH materials, we would love to hear from you!
1.10.1 Survey
We appreciate feedback about all aspects of the DaSEH user experience including but not limited to technical challenges, potential improvements, or new ideas on how to use the our materials in the classroom. Students, instructors, or anyone engaging with DaSEH can leave open ended feedback here:
You can also add your name and email to the DaSEH Interest Form to be contacted about upcoming events and opportunities:
1.10.2 Feedback for this Guide
If you have feedback for this guide about how we can improve the content, please comment on our GitHub repository here.
This work is licensed under a Creative Commons Attribution-NonCommercial-ShareAlike 4.0 International License.
![]() DaSEH is funded by the National Institute of Environmental Health Sciences 1R25ES035590-01.
DaSEH is funded by the National Institute of Environmental Health Sciences 1R25ES035590-01.