Choosing Genomics Tools: GenePattern Activity
Bulk RNA-seq differential expression analysis
The datasets for this activity consist of 20 Breast cancer primary tumor samples with 20 normal matched samples from TCGA as explained in the study “Molecular analysis of TCGA breast cancer histologic types”.
The aim of this activity is to answer the question – “What genes differentiate samples with breast cancer from samples without breast cancer?”. This is an example of differential expression analysis, a downstream analysis step in the bulk RNA-seq workflow.
Download Data and log into the GenePattern platform
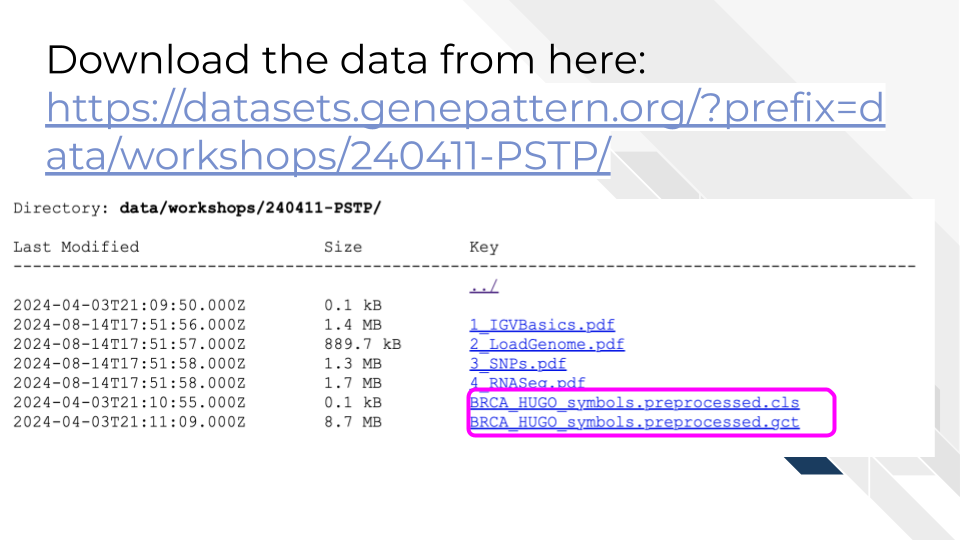
Download
the relevant datasets.
• Download
BRCA_HUGO_symbols.preprocessed.cls
•
Download
BRCA_HUGO_symbols.preprocessed.gct
Note, clicking on the filenames should automatically download them, otherwise you might need to right click.
Make sure you know where they are saved on your computer as you’ll be uploading them in an upcoming step.
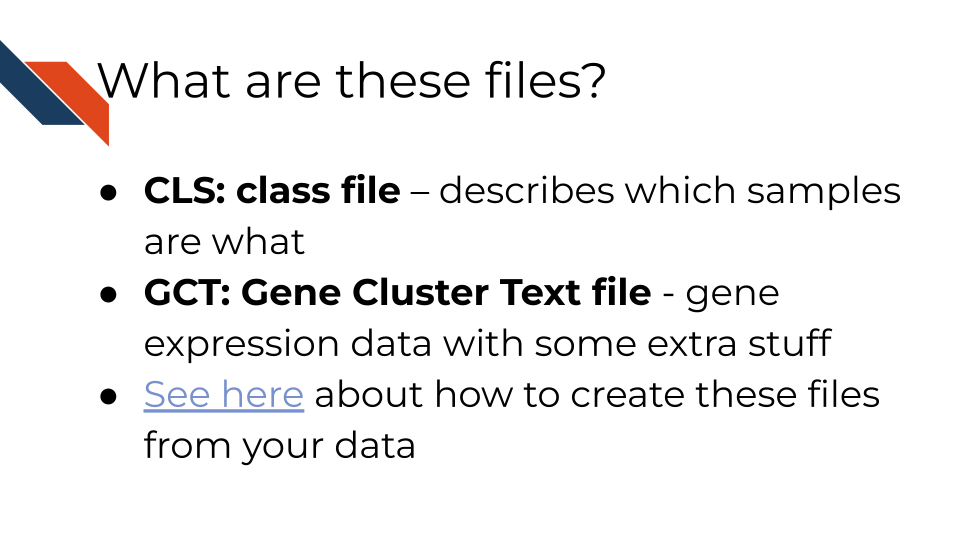
What are these file types?
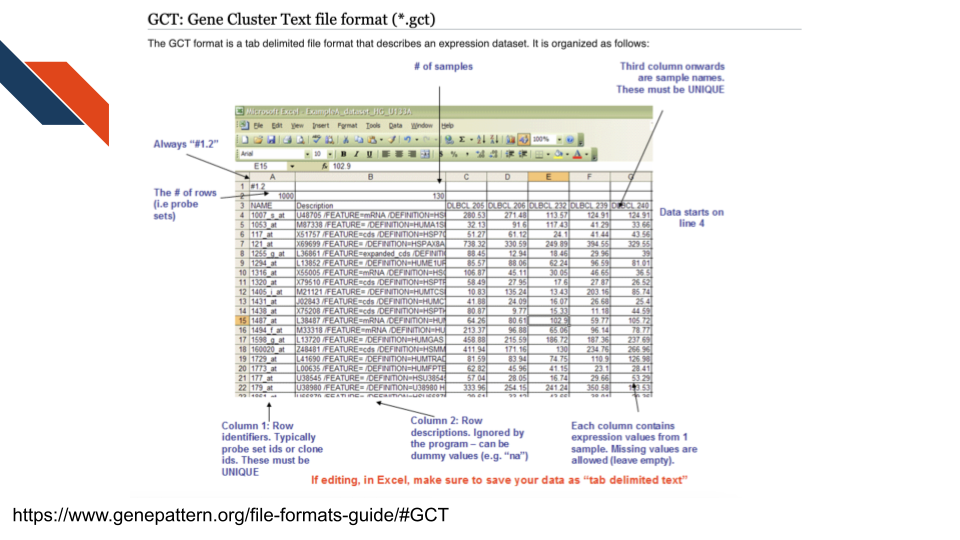
The gct file is a Gene Cluster Text file format used to
describe an expression dataset. See more
about gct files at this GenePattern resource.
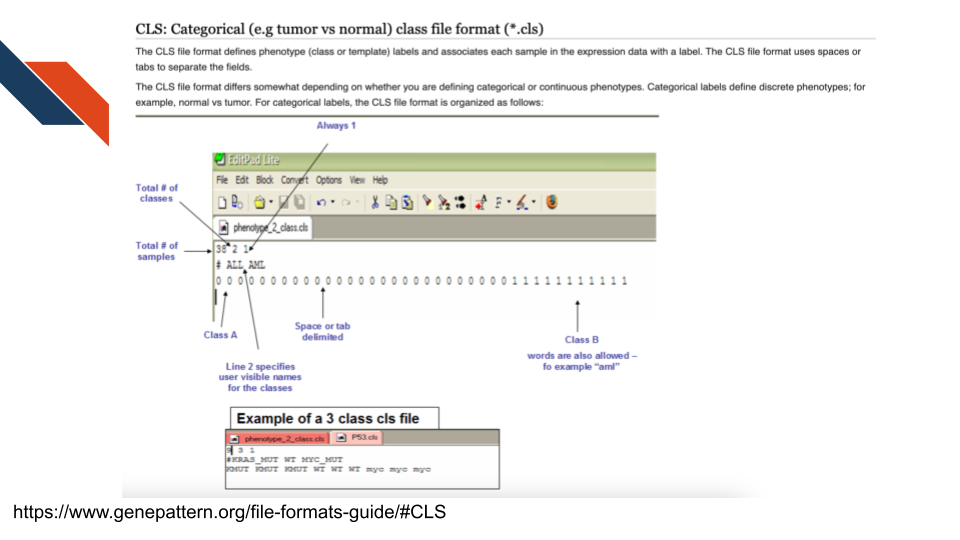
The cls file is a categorical (e.g., tumor vs normal)
class file format, specifying phenotype or class labels associated with
each sample in the expression data. See more
about cls files at this GenePattern resource.
See this resource from GenePattern for more information on creating these input files for your work.
Go to the GenePattern platform and sign in.
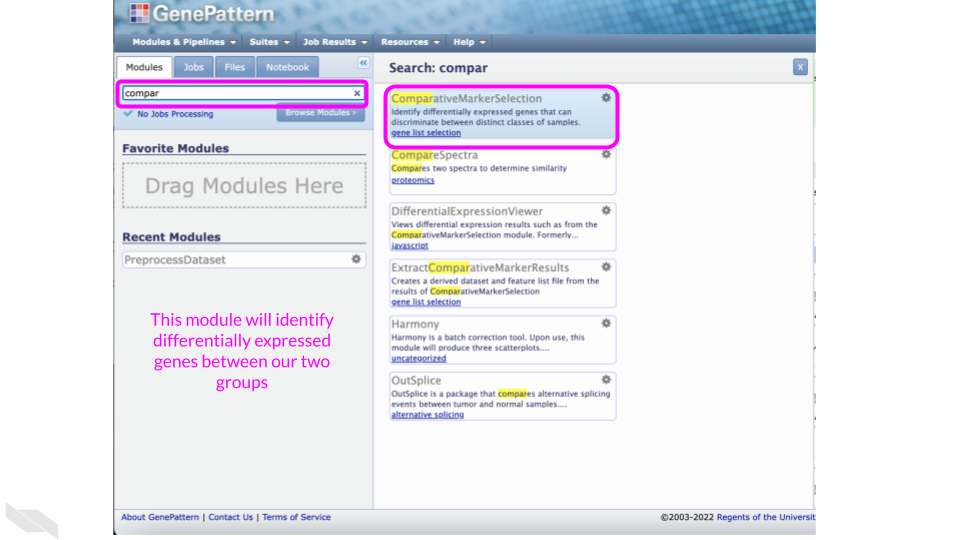
Run the ComparativeMarkerSelection Module to identify differentially expressed genes between the two groups
Find the “ComparativeMarkerSelection” Module by searching for it in the search tool.
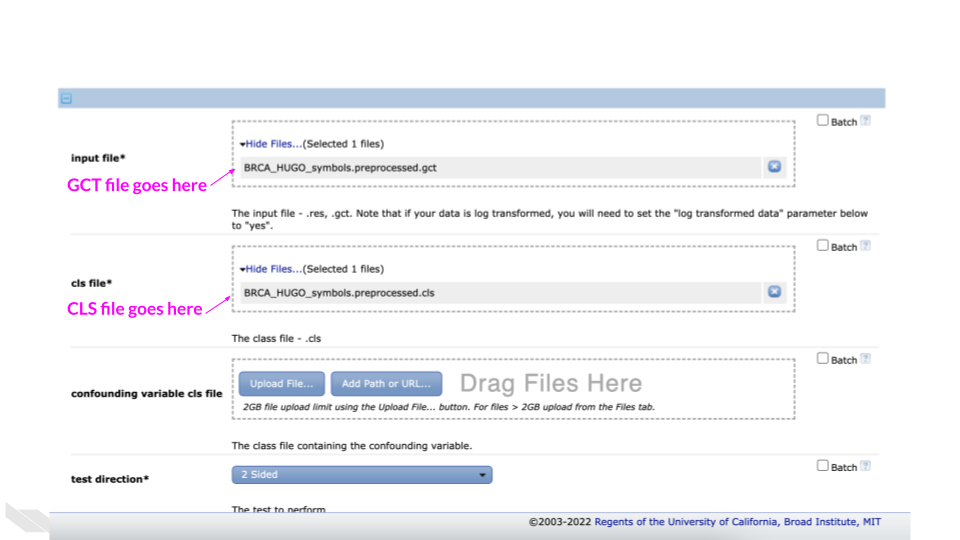
Select the gct file
(BRCA_HUGO_symbols.preprocessed.gct) for the “Input file*”
option.
Select the cls file
(BRCA_HUGO_symbols.preprocessed.cls) for the “cls file*”
option.
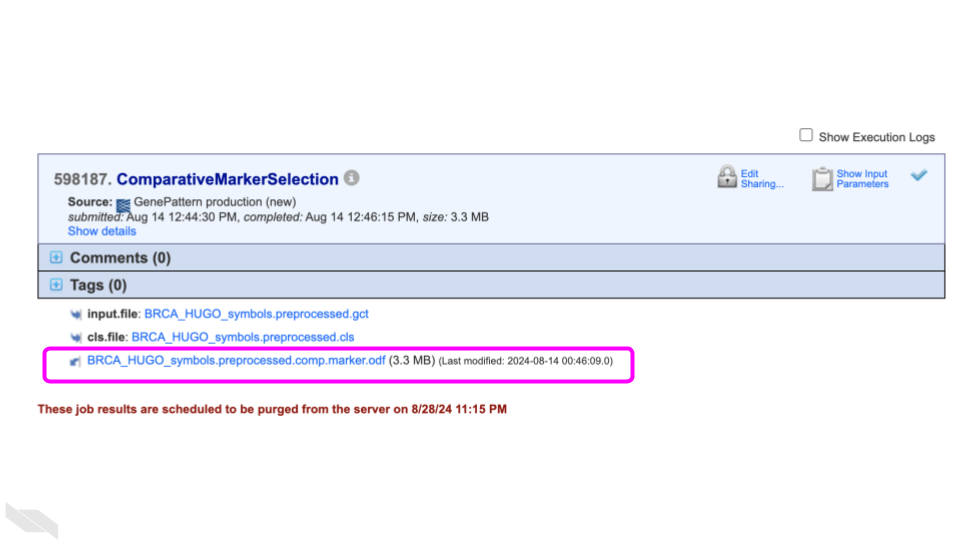
Scroll down and click the Run button.
Click on the produced odf file
(BRCA_HUGO_symbols_preprocessed.comp.marker.odf).
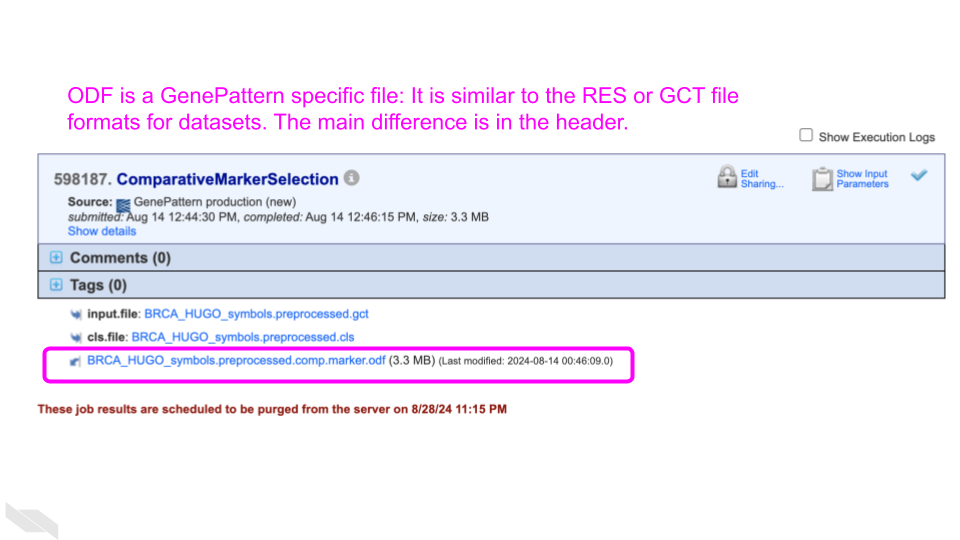
What is this file type?
An ODF is an Output Description Format file, a GenePattern specific filetype. It is similar to a GCT file format, describing a gene expression dataset; however, the ODF filetype has a specialized header. See more information about ODF files from GenePattern.
Run the DifferentialExpressionViewer module to make a heatmap of the differentially expressed genes
In the opened side panel, scroll down and under the “Send to Module” heading, click on “DifferentialExpressionViewer”.
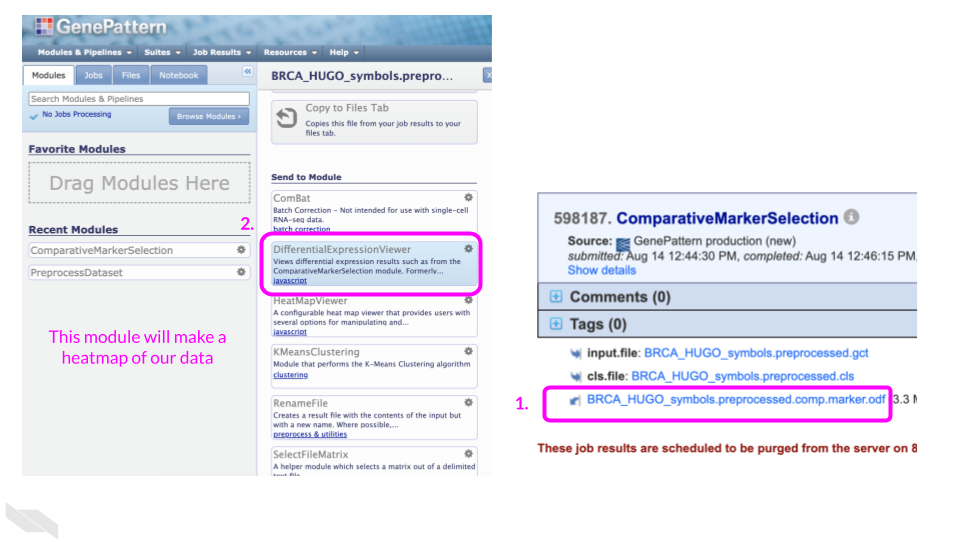
Confirm that the ODF file has already been selected for the “differential expression filename*“.
Click the upload file button for the “dataset filename*” section.
Select the gct file
(BRCA_HUGO_symbols.preprocessed.gct).
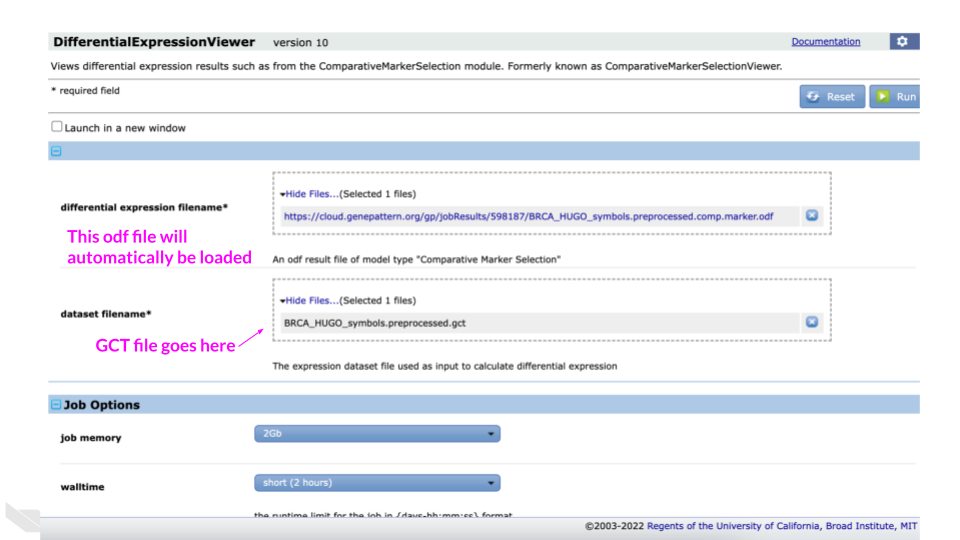
Click the Run button.
Inspect and customize the heatmap
Inspecting the heatmap we see gene names are the row names and sample names are the column names.
Color-wise there are blues and reds and whites. But without a legend, what do these colors mean?
Click on the “Edit” dropdown menu in the top left.
Click on “Display Options”.
Click the checkbox next to “Display Legend”
Click “OK”.
From this newly added legend, we see that red is a “row max” value while blue is a “row min” value.
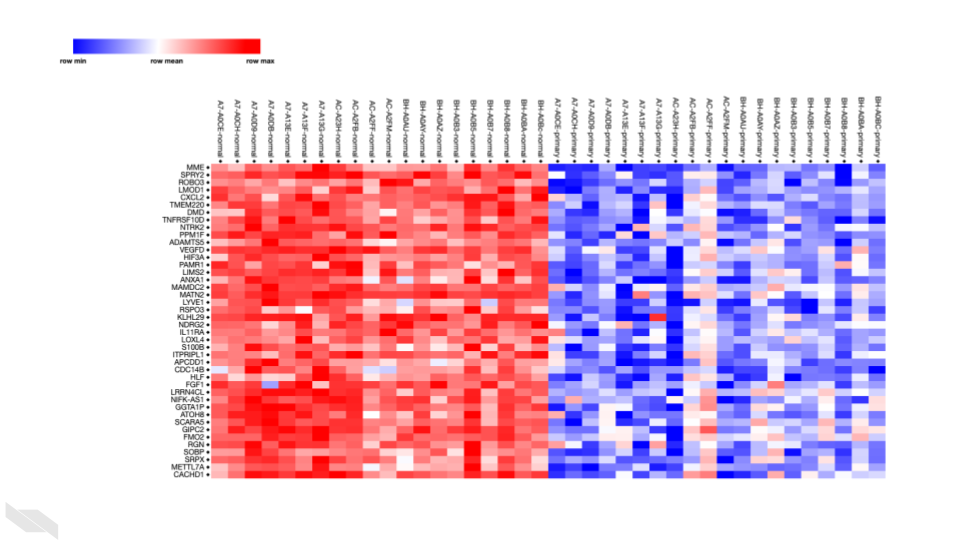
If a gene has very red colors across normal tissue samples and very blue colors across primary tissues – that translates to that gene being upregulated in the matched normal tissues. MME is an example of this. (MME could also be termed downregulated in primary tumor samples).
To save the heatmap (specifically those genes identified as comparative markers or differentially expressed genes) ….
Click on the “File” dropdown menu in the top left.
Click on “Save Image”.
You can select the “File type:” you want.
svg is default. png is the other option.
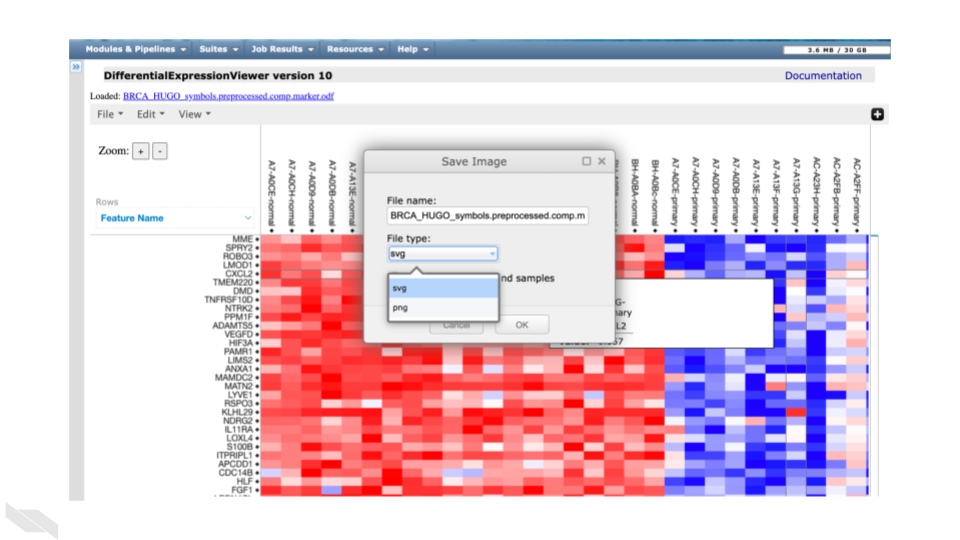
If you click the “Include all features and samples” checkbox, it will include all genes whether they were identified as differentially expressed or not, producing a much larger heatmap.
Click on “OK”.
Fold Change and statistical test statistics (e.g., significance) are provided in a related table that you can also download.
Click on the “File” dropdown menu in the top left.
Click on the “Save Table (.txt)”
If you want to save it to your computer, click on “Download” and select “OK”.