15 Activity
15.1 Launching Galaxy on AnVIL
Note that, in order to use Galaxy, you must have access to a Terra Workspace with permission to compute (i.e. you must be a “Writer” or “Owner” of the Workspace).
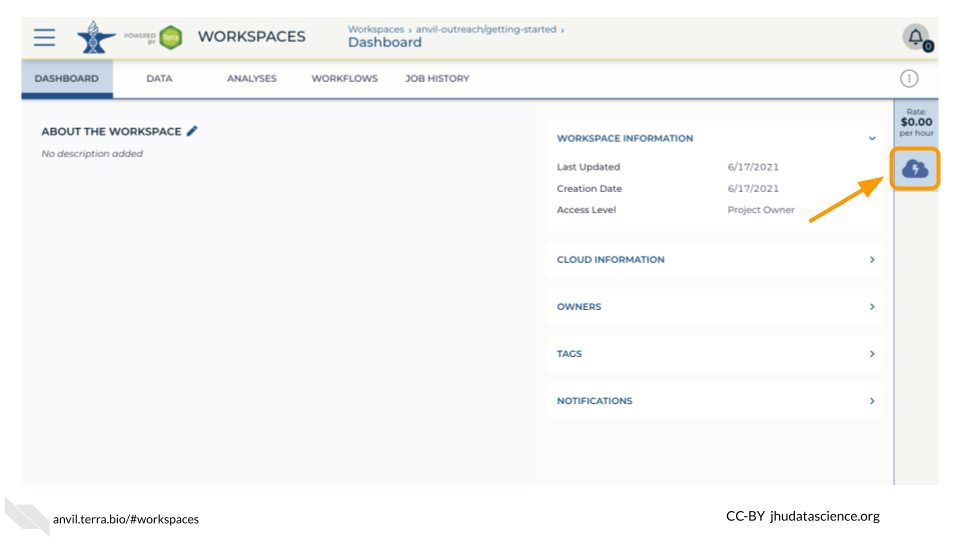
Open your Workspace, and click on the “Environment configuration” button, a cloud icon on the righthand side of the screen.
Under Galaxy, click on “Create new Environment”. Click on “Next” and “Create” to keep all settings as-is. This will take 8-10 minutes.
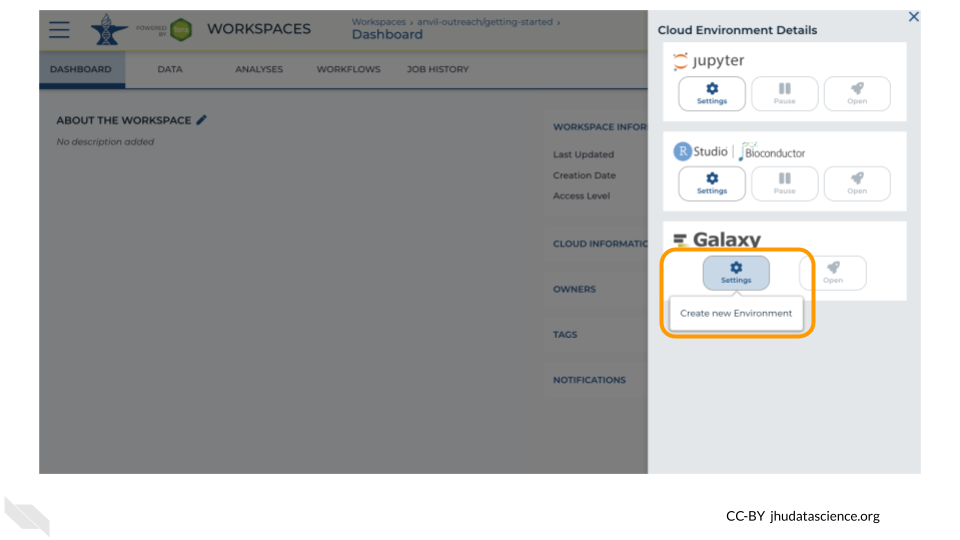
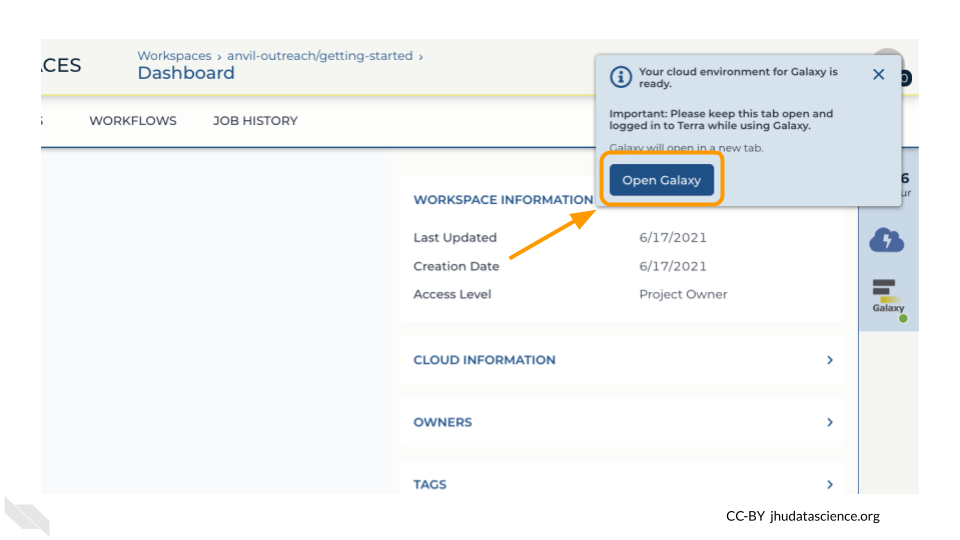
Click on “Open Galaxy” when the environment is ready.
15.2 Importing Data into Galaxy on AnVIL
When we cloned our workspace, our cloned workspace linked to the original data! We will upload three files from the AnVIL workspace into Galaxy, though we need only one fastq data sequence file for our activity. The others will be used if you want to continue with a related activity that performs alignment and variant discovery after quality control. These three files are (1) the forward and (2) the reverse reads for our sample, as well as, (3) the reference genome for SARS-CoV-2. There are two sets of reads for our sample because the scientists who collected it used paired-end sequencing. The sample files we are looking at end in fastq because they are raw data from the sequencer. The reference genome ends in .fasta because it has already been cleaned up by scientists.
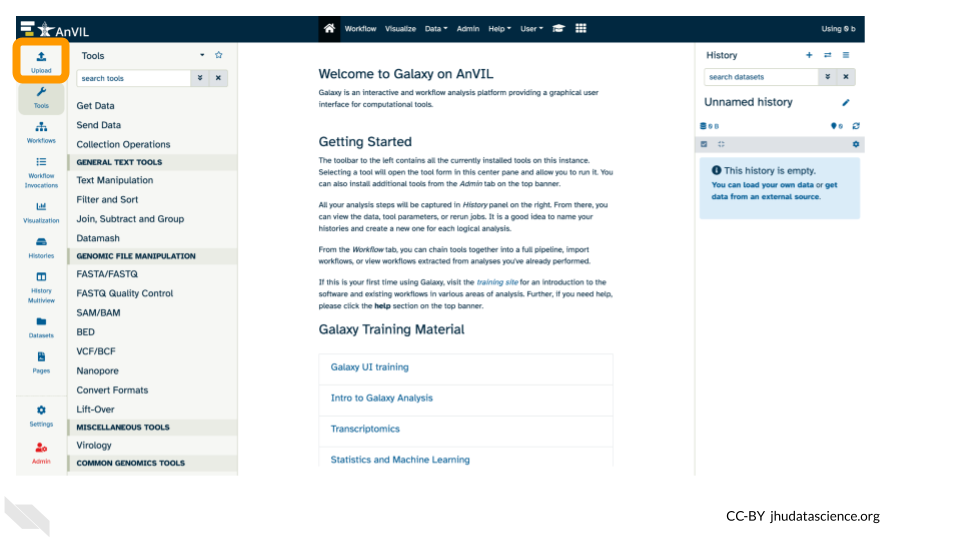
- Click on “Upload Data” in the Tools pane.
- Click on “Choose remote files” at the bottom of the popup.
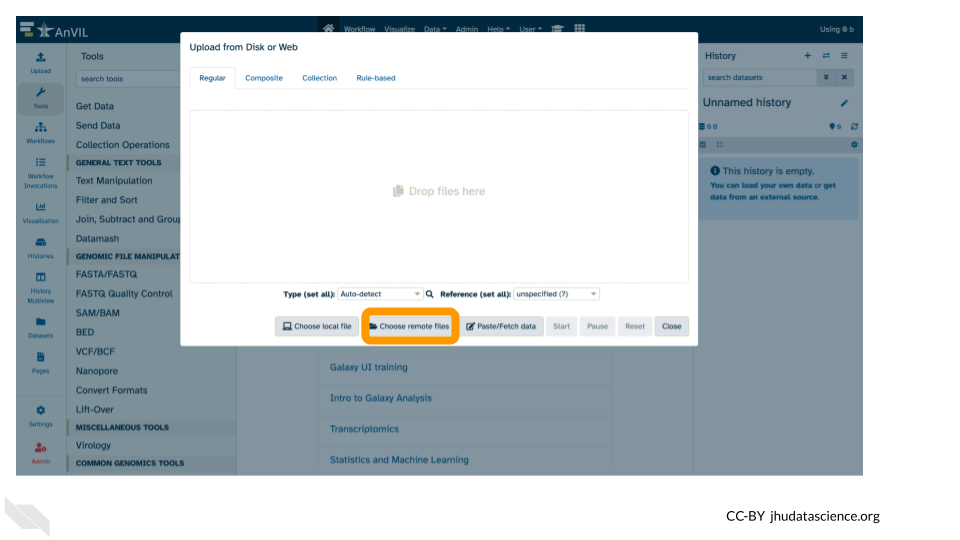
If you had files locally on your computer that you wanted to upload, you would use the “Choose local file” button.
Or if you had files you wanted to import from a data repository like Zenodo, you would use the “Paste/Fetch data” button.
We’re using the “Choose remote files” button because we have data in our AnVIL workspace that we can import into the Galaxy on AnVIL instance.
- Double-click the Workspace folder.
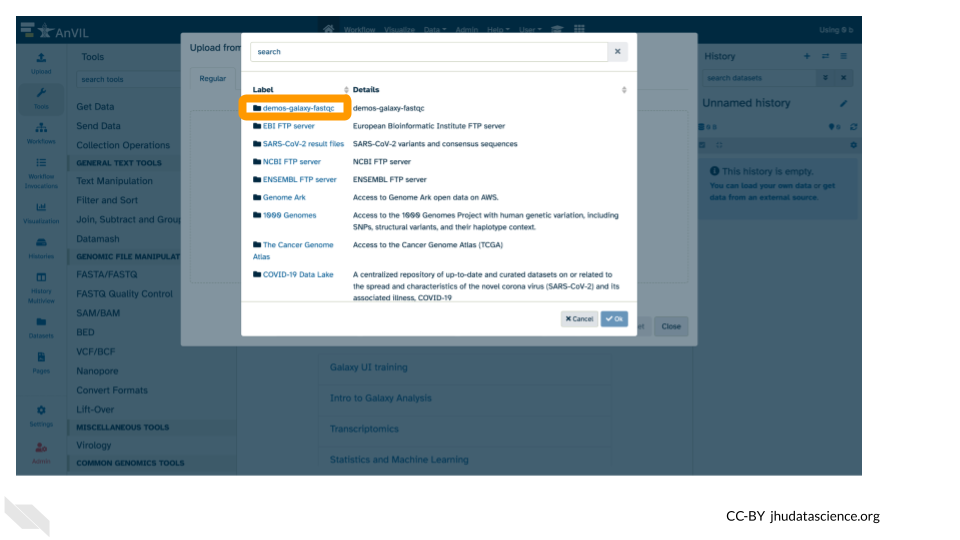
- Upload the sample sequence data files
- Double-click “Tables/”
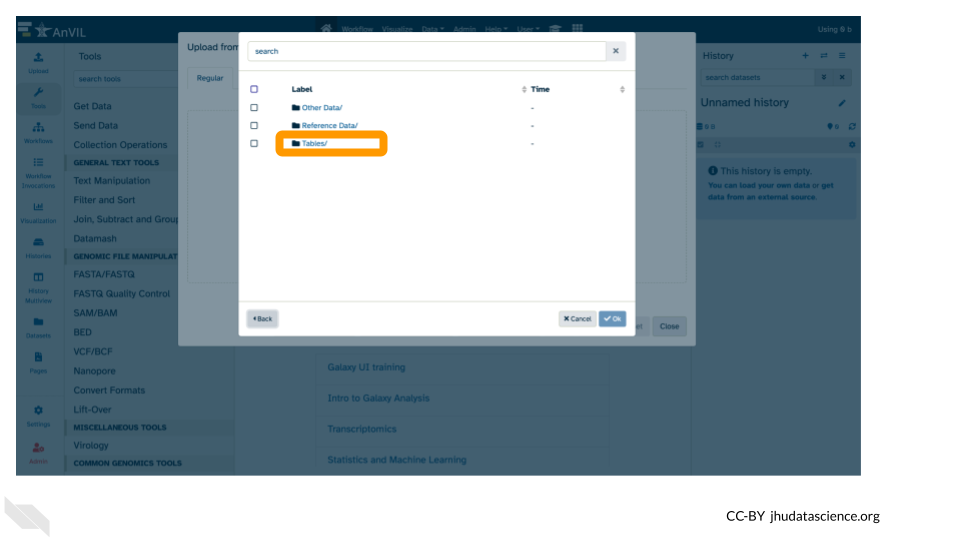
- Then double-click “sample/”.
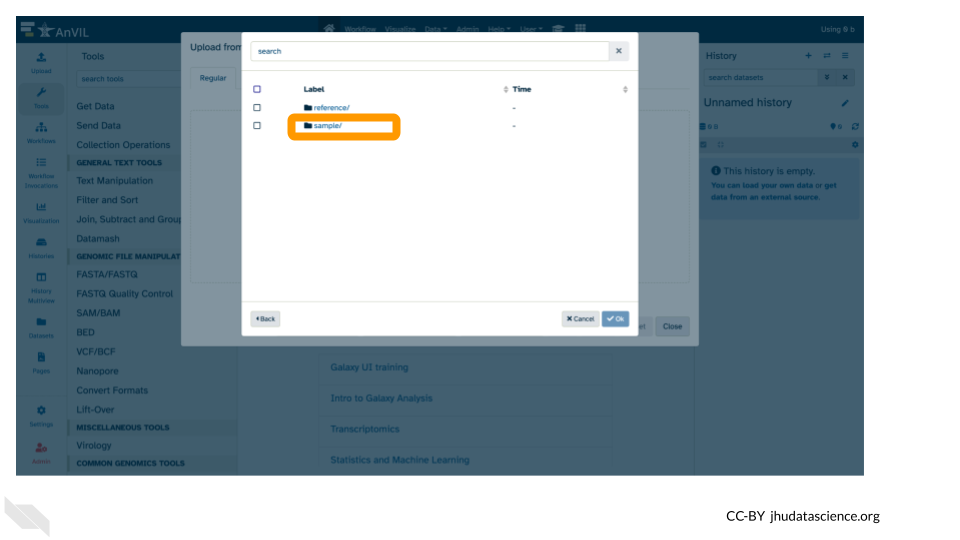
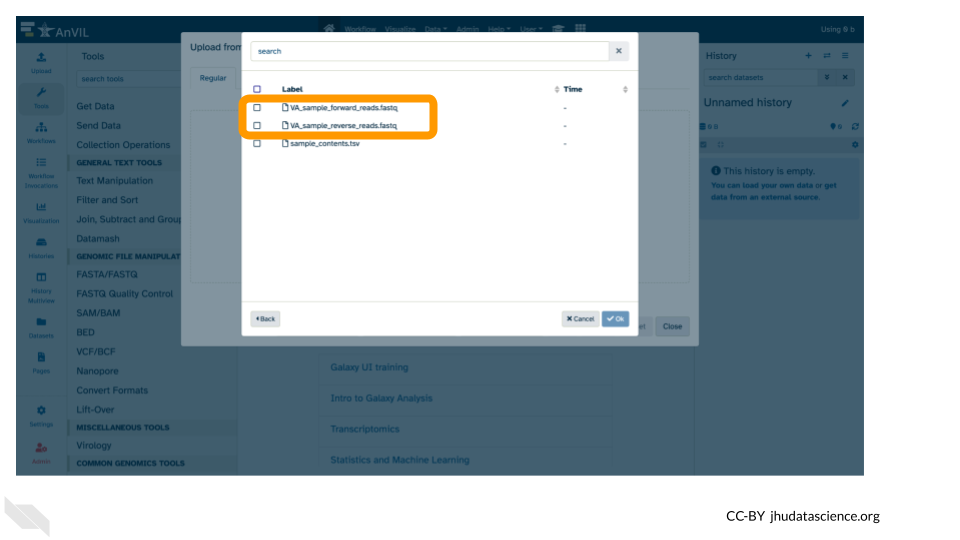
- Click the two sample
.fastqfile checkboxes to select them.
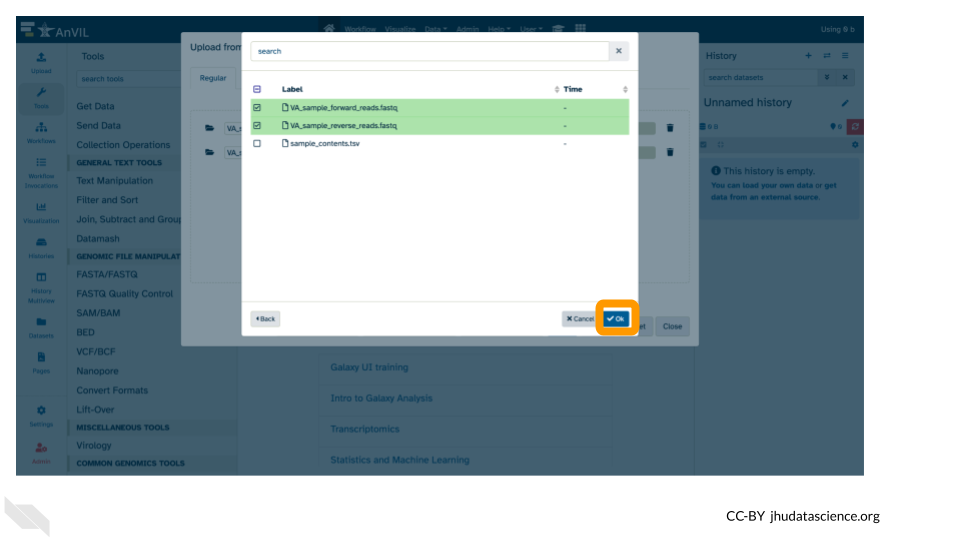
- These files will be highlighted in green when ready. Click “Ok”.
Expand for Steps 5- 6: Upload the reference genome
- Repeat steps 2 and 3 from above.
- Click on “Choose remote files” at the bottom of the popup.
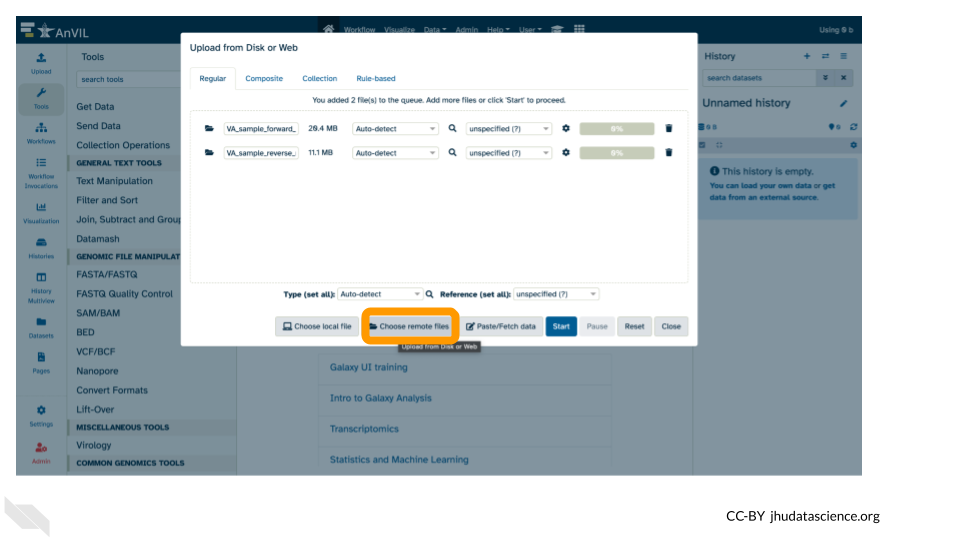
- Double-click the Workspace folder.

- Upload the reference genome file
- Again, double click “Tables/”.

- This time, double click “reference/”.
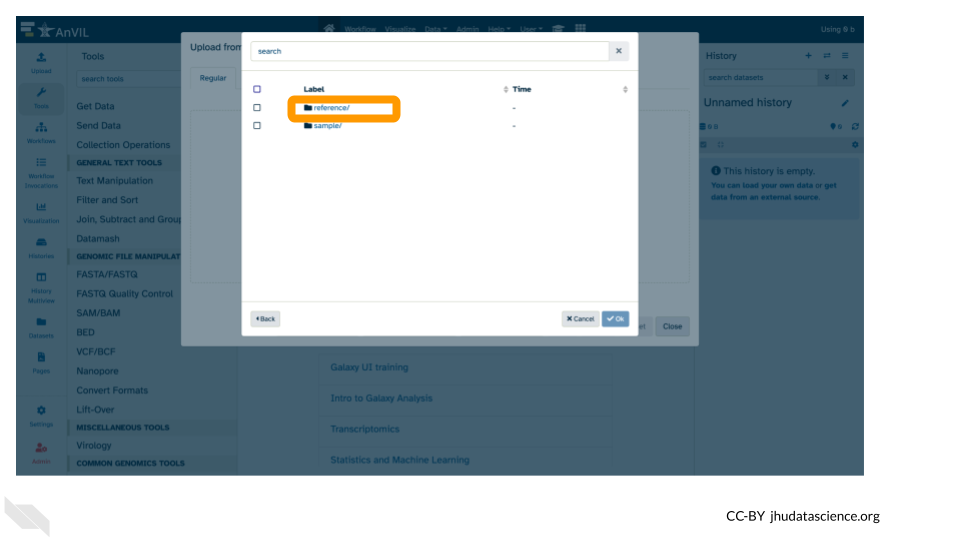
- Click the
fastafile.
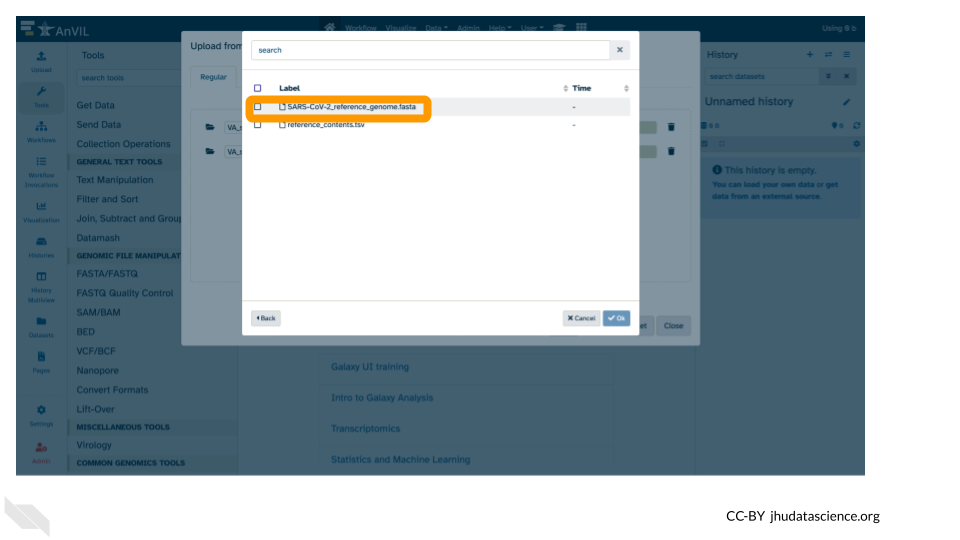
- This file will be highlighted green and click “Ok”.
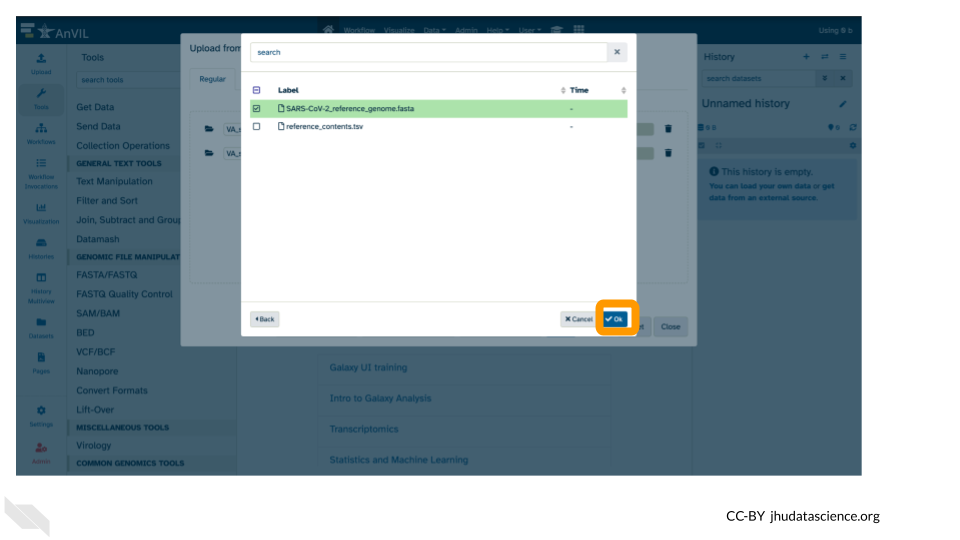
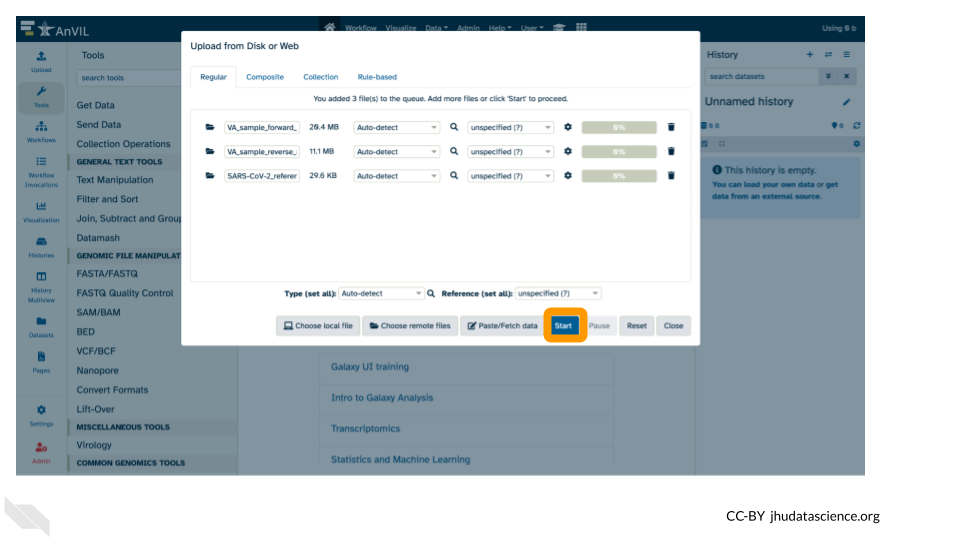
7. Click “Start”
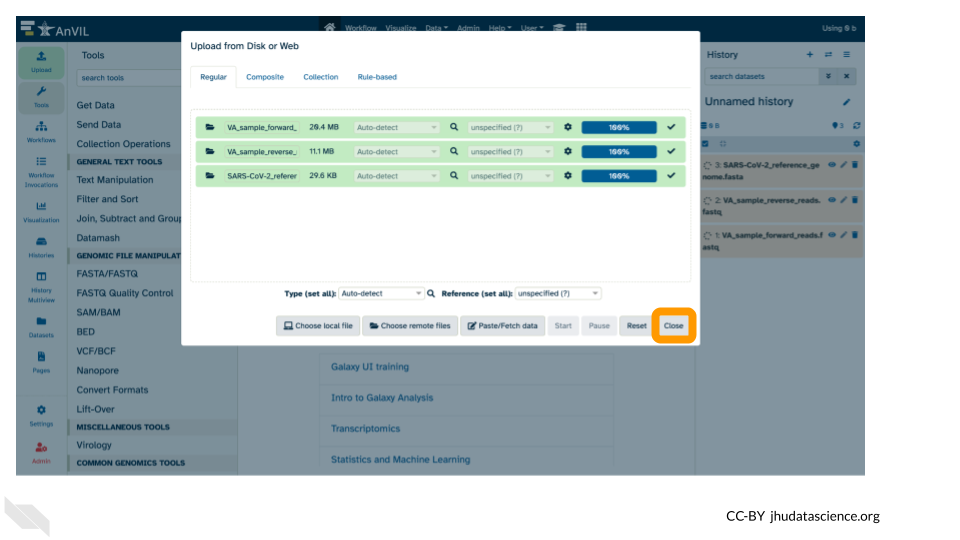
- Once complete, click “Close”.
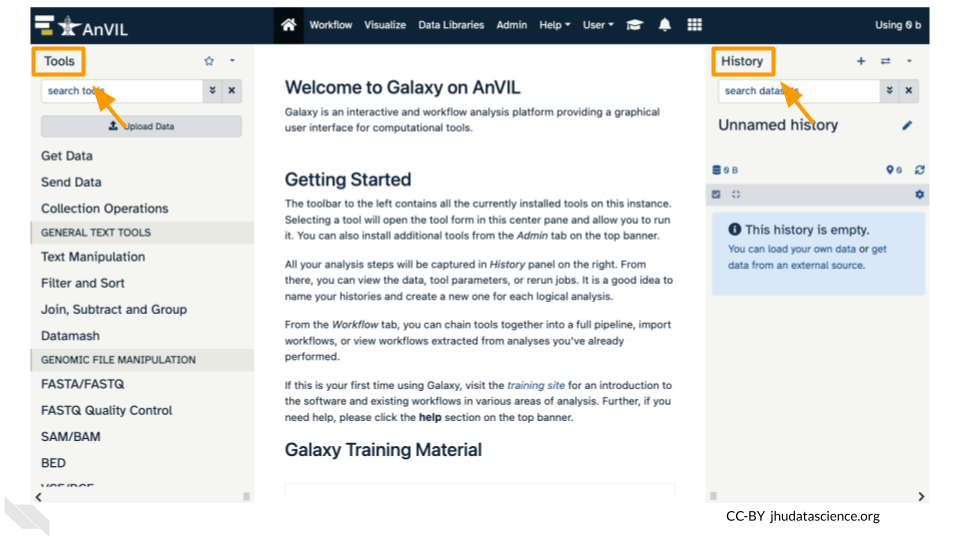
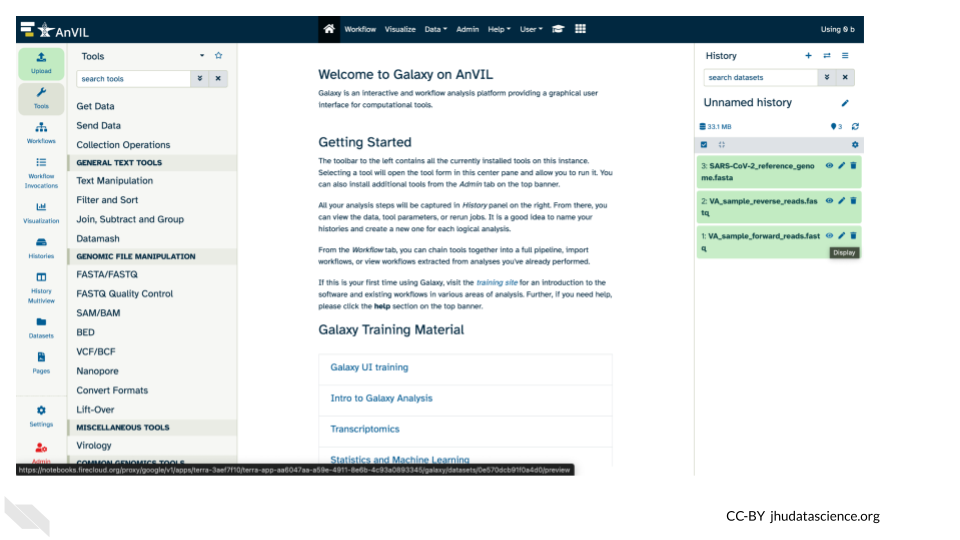
- Confirm that the files uploaded successfully by looking at the file names in the Galaxy History pane.
Note that the files will be highlighted in green in the Galaxy History pane once they are uploaded and available.
15.3 Examining fastq sequence data files
We will examine data in fastq format. This is the typical output from an Illumina Sequencer, but also the standard format output from most sequencers.
- Use your mouse and click on the eye icon (
 ) of the first
 fastqfile (VA_sample_forward_reads.fastq).
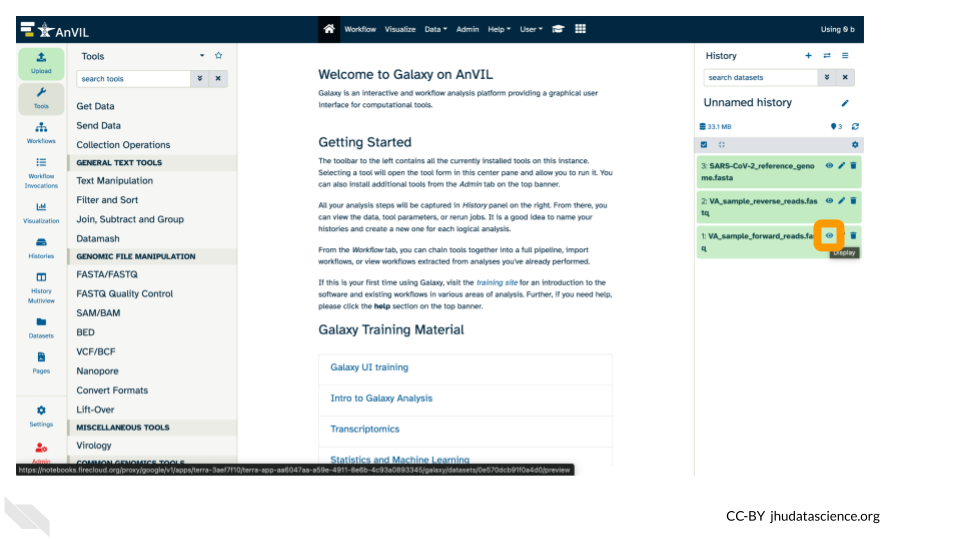
- After clicking the eye icon, in the Main screen you will see something like this:
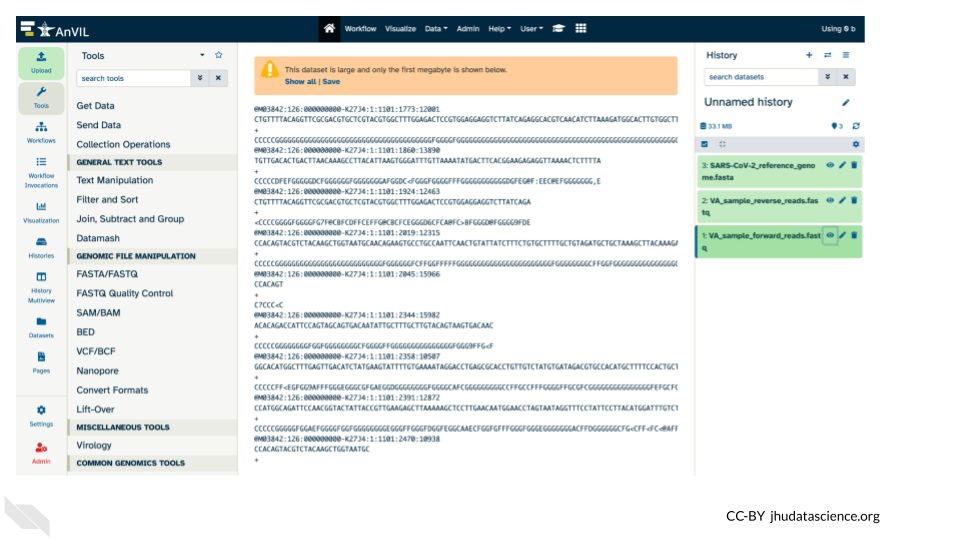
Expand for FASTQ files explained
For more information on the contents of a FASTQ file, consider this resource from Illumina.
QUESTIONS:
How many lines in a .fastq file represent an individual read?
What does each line represent?
Why is the final line for each read (the quality score) important?
Breakout Box: Learn more about quality scores
To save space, the sequencer records an ASCII character to represent scores 0-42. For example 10 corresponds to “+” and 40 corresponds to “I”. FastQC (a tool we’ll be using next) knows how to translate this. This way of encoding the data is often called “Phred” scoring.
What does 0-42 represent? These numbers, when plugged into a formula, tell us the probability of an error for that base. This is the formula, where Q is our quality score (0-42) and P is the probability of an error:
Q = -10 log10(P)
Using this formula, we can calculate that a quality score of 40 means only 0.00010 probability of an error!
15.4 Finding and Using FastQC
FastQC is a tool which aims to provide simple quality control checks on raw sequence data coming from high throughput sequencing pipelines. It provides a set of analyses which you can use to get a quick impression of whether your data has any problems of which you should be aware before doing any further analysis.
- Use the search tools bar in the upper left (within the tools pane in Galaxy)
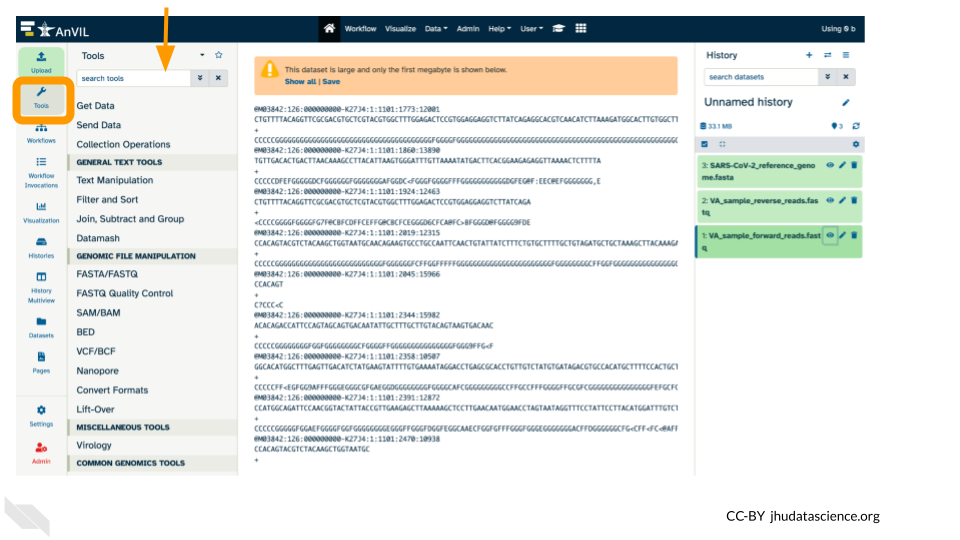
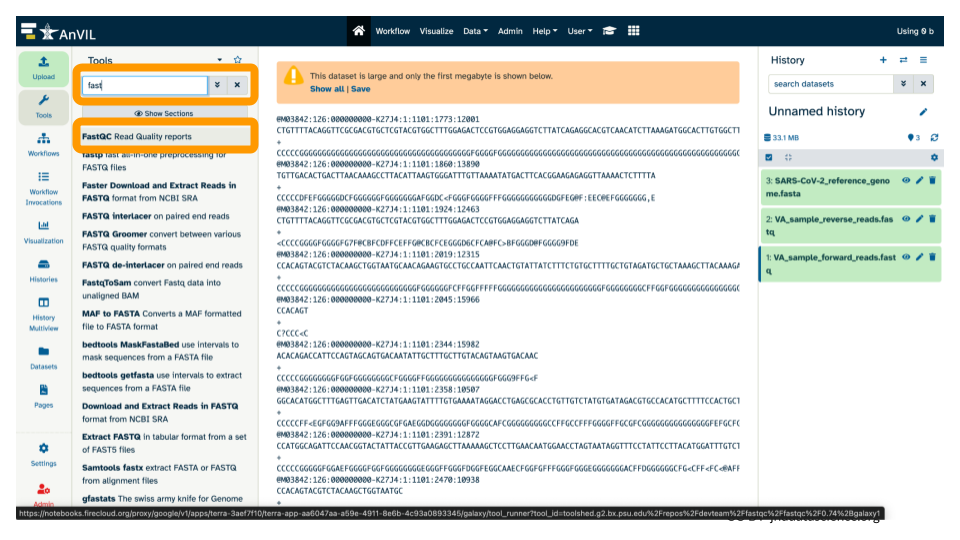
- Type
fastto search for FastQC, and select the tool in the list below.
- This will open the tool menu in the middle pane.
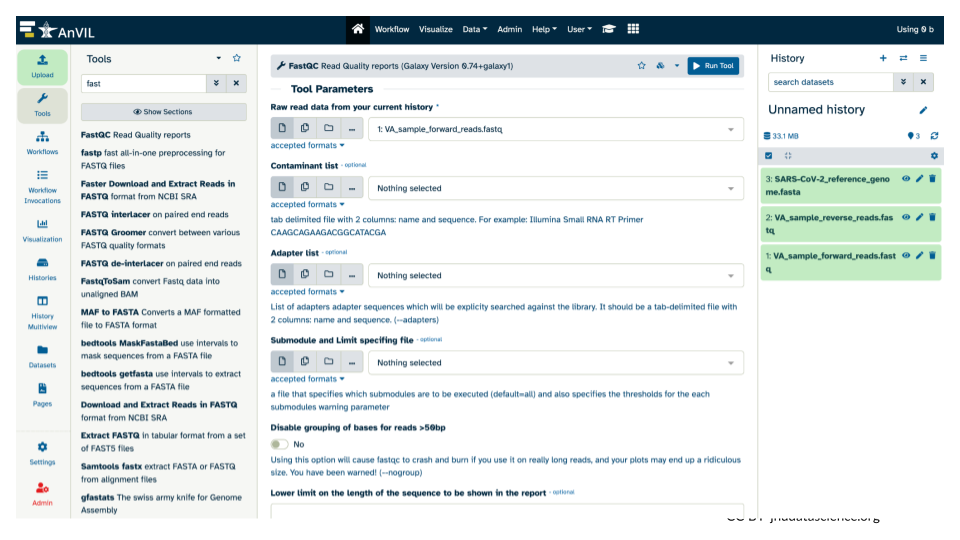
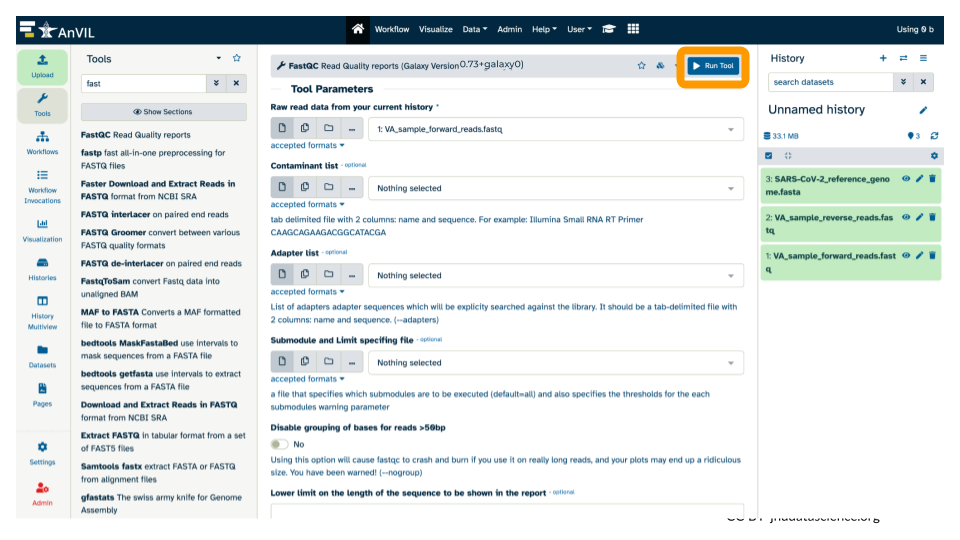
- Switch the version of FastQC to
0.73+galaxy0
- Select the Versions icon (3 cubes).
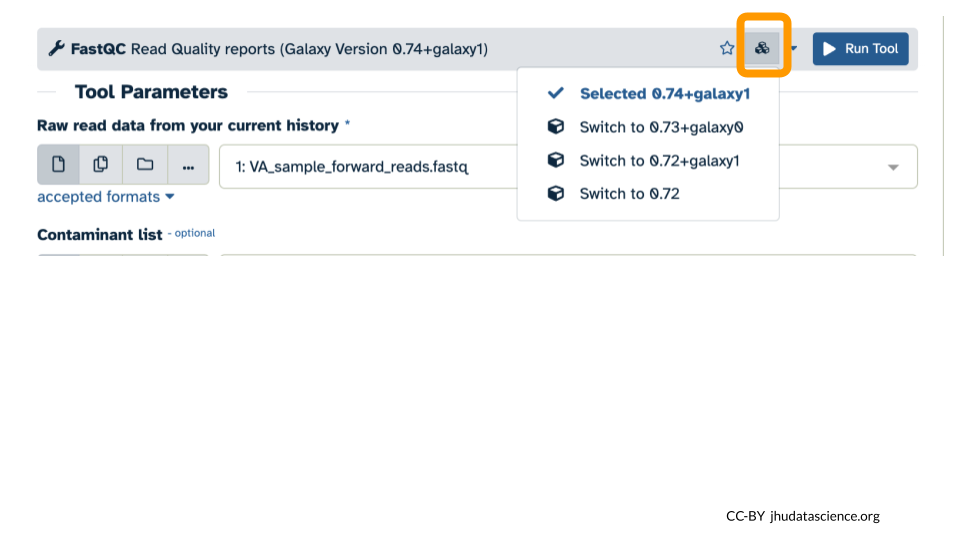
- Select “Switch to 0.73+galaxy0” from the dropdown menu.
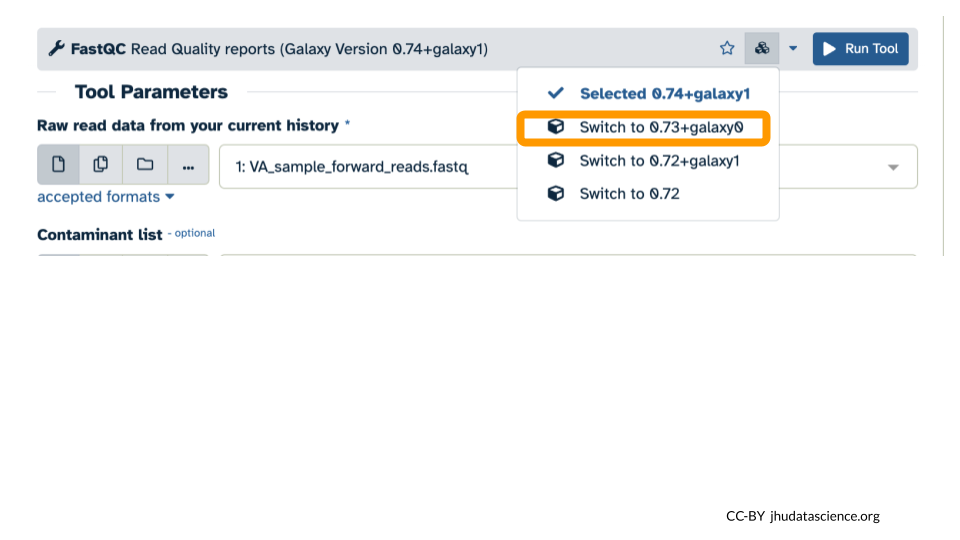
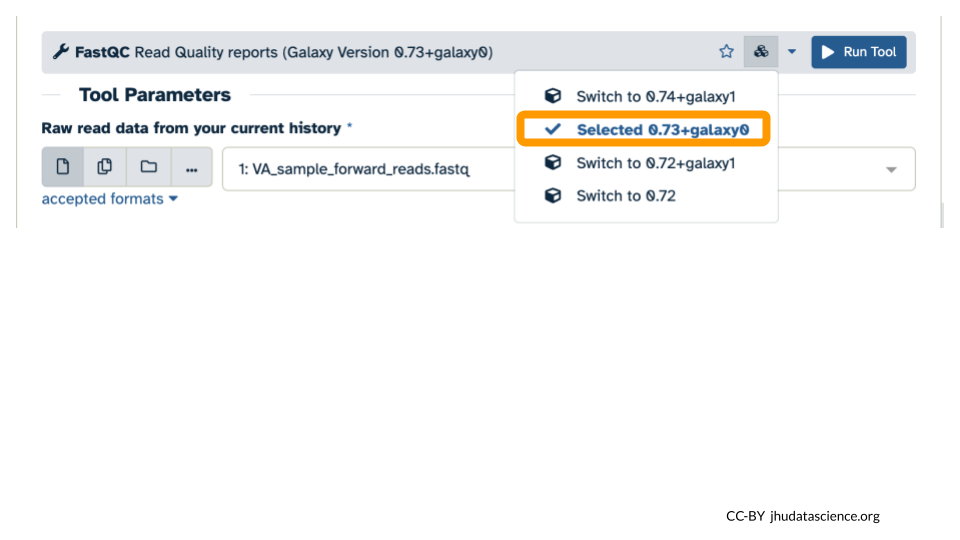
- Confirm that the version now says “Selected 0.73+galaxy0”.
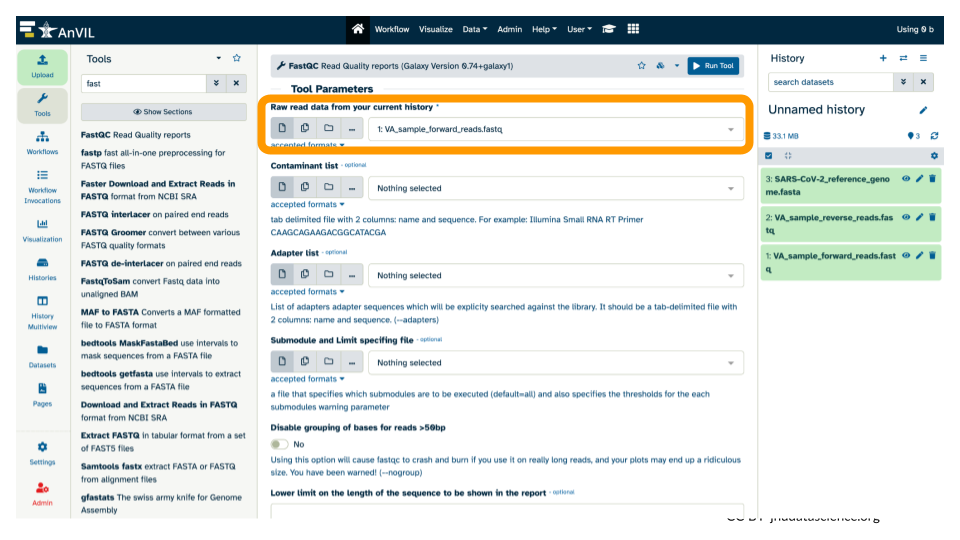
- Confirm or select the correct input for FastQC (the forward reads fastq file).
- Run FastQC by clicking the blue “Run Tool” button.
- After submitting the job to run, the middle pane should have a message highlighted in green.
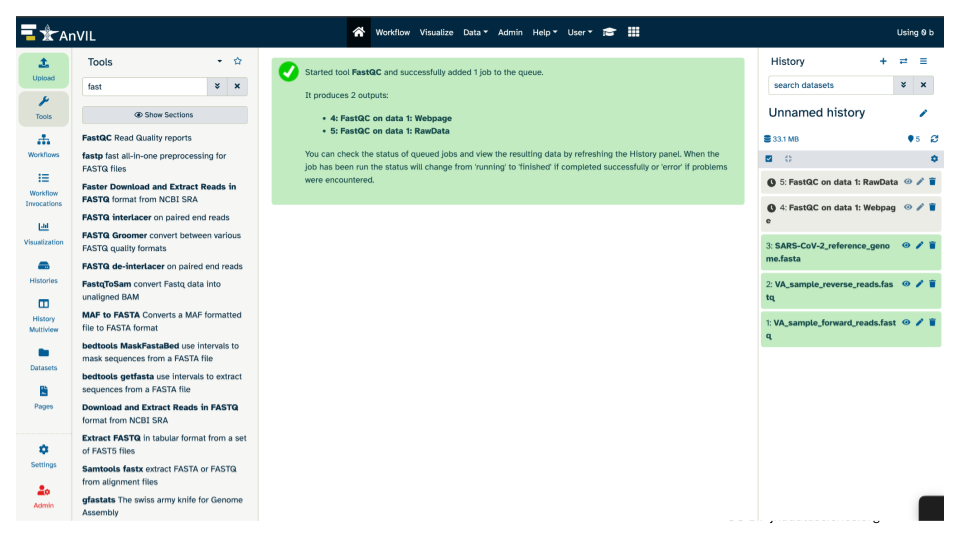
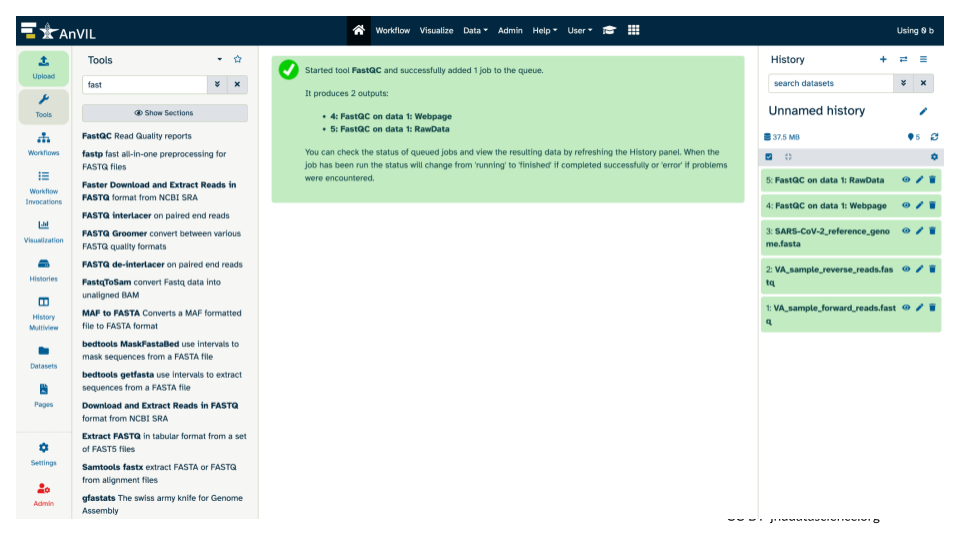
The history pane should also list what will be the output(s) from the tool. Note, before the job has finished running, these output(s) will be highlighted in gray. While running, the output(s) will be highlighted in an orange cream color. And once the tool runs successfully, the output(s) will be highlighted in green.
15.5 Examining the FastQC quality control summary report
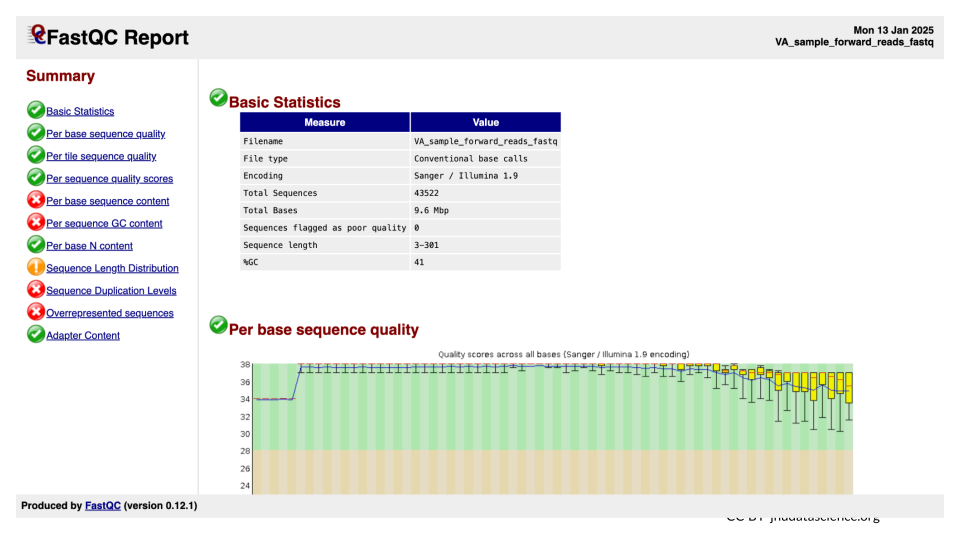
We will examine the FastQC output in webpage or html format. This form of the output provides graphs and a flag of “Passed”, “Warn”, or “Fail” for each subsection within the quality control analysis.
- Use your mouse and click on the eye icon (
 ) of the FastQC Webpage output (FastQC on data 1: Webpage).

- This will open up a summary report for the sequencing file in the middle pane that you can scroll.
Expand for FastQC summary report explained
For more information on the contents of the output quality control summary report from FastQC, consider this resource from Michigan State
QUESTIONS:
Explore “Basic Statistics”. How many total reads are there? Have any been flagged as poor quality? What is the sequence length?
Explore “Per base sequence quality”. Based on the Basic Statistics, is 28-40 a good or bad quality score?
Is it okay to proceed based on the per base sequence quality?
15.6 Exporting your results
In case you want to view the results later, you can download the file.
- Click on the name of the results you want to export/save, and it will expand the info shown for that file. Click the floppy disk/save icon.
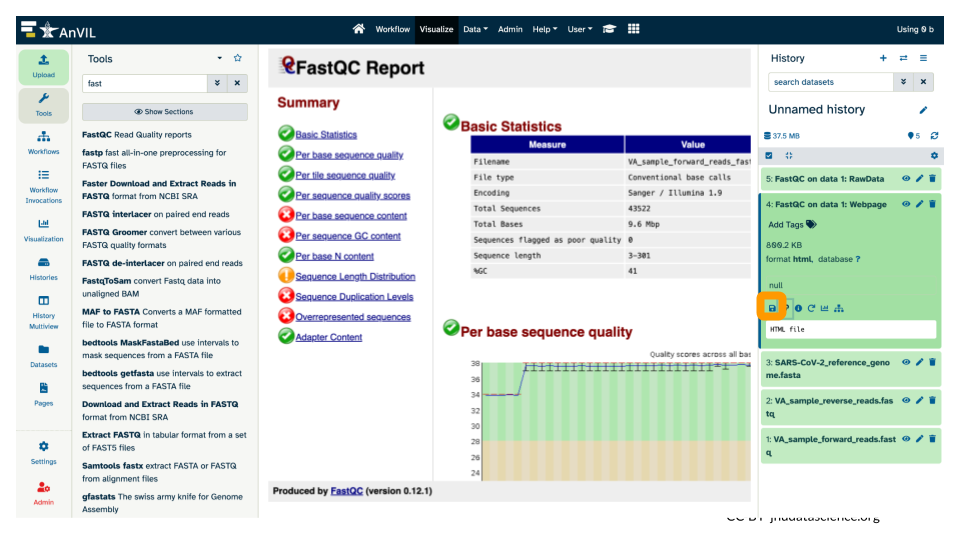
This will download a zip (compressed) file with the results to your computer. Uncompress it to view it locally.
15.7 Shutting down Galaxy on AnVIL
Once you are done with your activity, you’ll need to shut down your Galaxy cloud environment. This frees up the cloud resources for others and minimizes computing cost. The following steps will delete your work, so make sure you are completely finished at this point. Otherwise, you will have to repeat your work from the previous steps.
Return to AnVIL, and find the Galaxy logo that shows your cloud environment is running. Click on this logo.
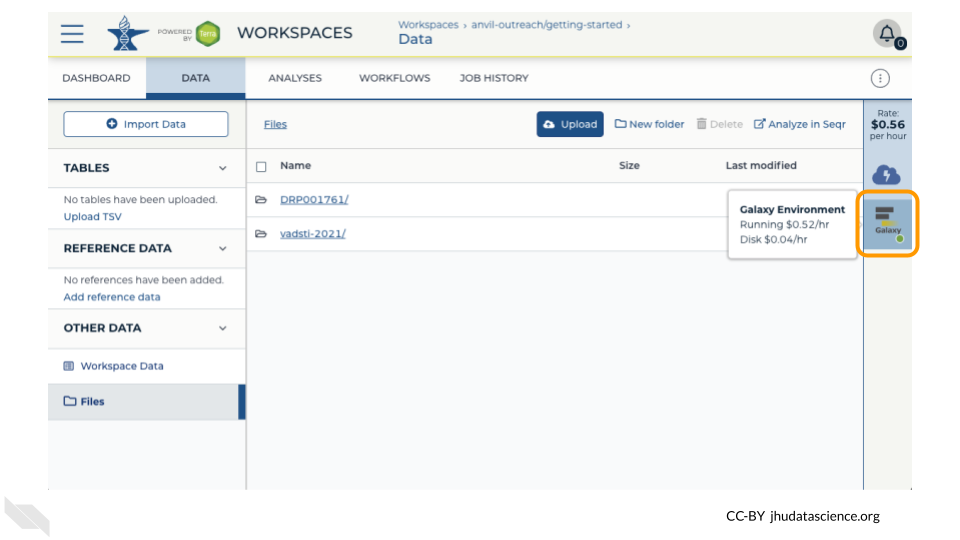
Next, click on “Settings”. Click on “Delete Environment”.
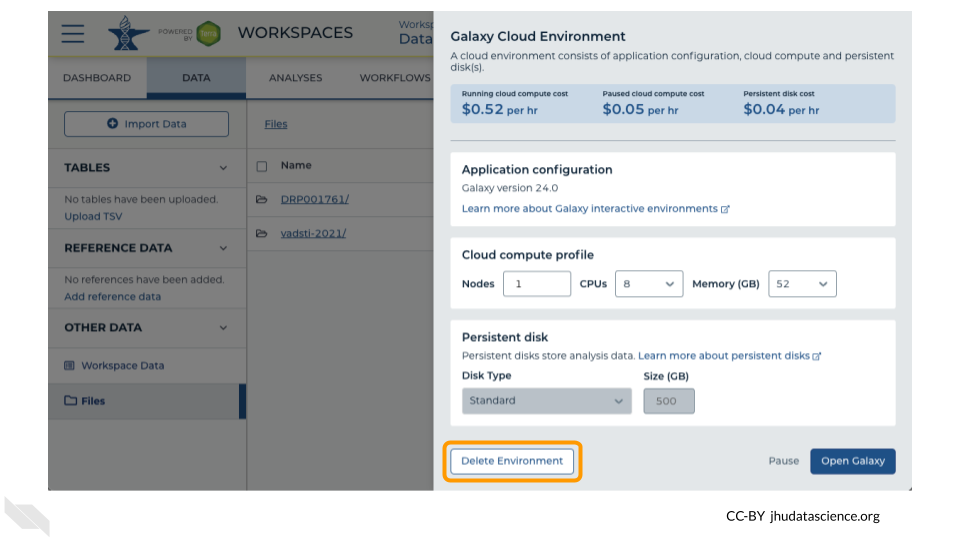
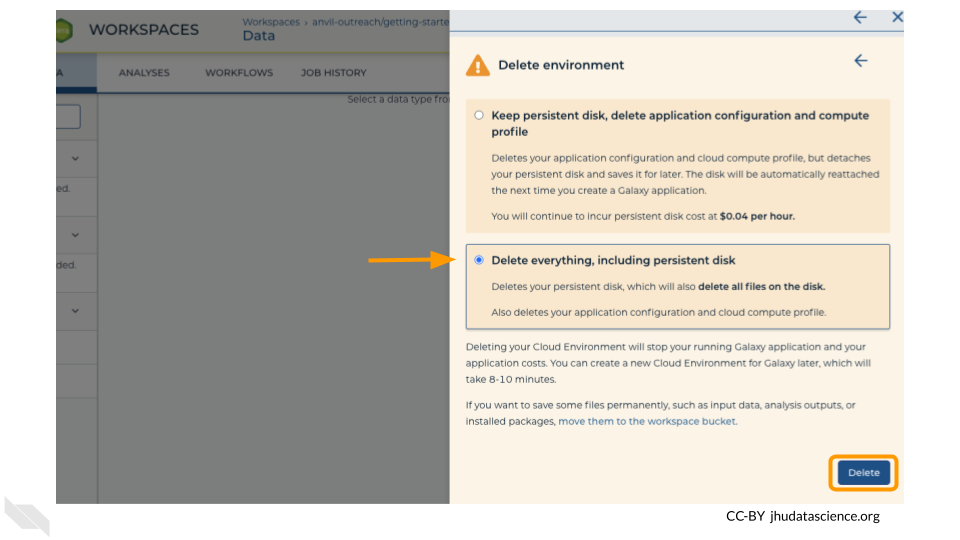
Finally, select “Delete everything, including persistent disk”. Make sure you are done with the activity and then click “Delete”.
