CRAN
13 March, 2025
Preview
Total CRAN downloads for all packages:
cran %>% dplyr::summarize(download_total = sum(count))## # A tibble: 1 × 1
## download_total
## <dbl>
## 1 23824CRAN package downloads over time, summarized by month.
cran_stats <- cran %>%
  separate(date, into=c("year", "month name", "day"), sep = "-") %>%
  unite("Month", c("year", "month name"), sep='-', remove=TRUE) %>%
  group_by(Month, package) %>%
  summarise(monthly_downloads = sum(count)) %>% #summarize monthly downloads by package
  filter(monthly_downloads > 0) #drop the 0's

ggplot(cran_stats, aes(Month, monthly_downloads, group=package, color = package)) +
  geom_line() +
  geom_point() +
  theme(panel.background = element_blank(), panel.grid = element_blank()) +
  theme(axis.text.x = element_text(angle = 90)) +
  labs(x = NULL,
       y = "Monthly Downloads",
       color = "R Packages")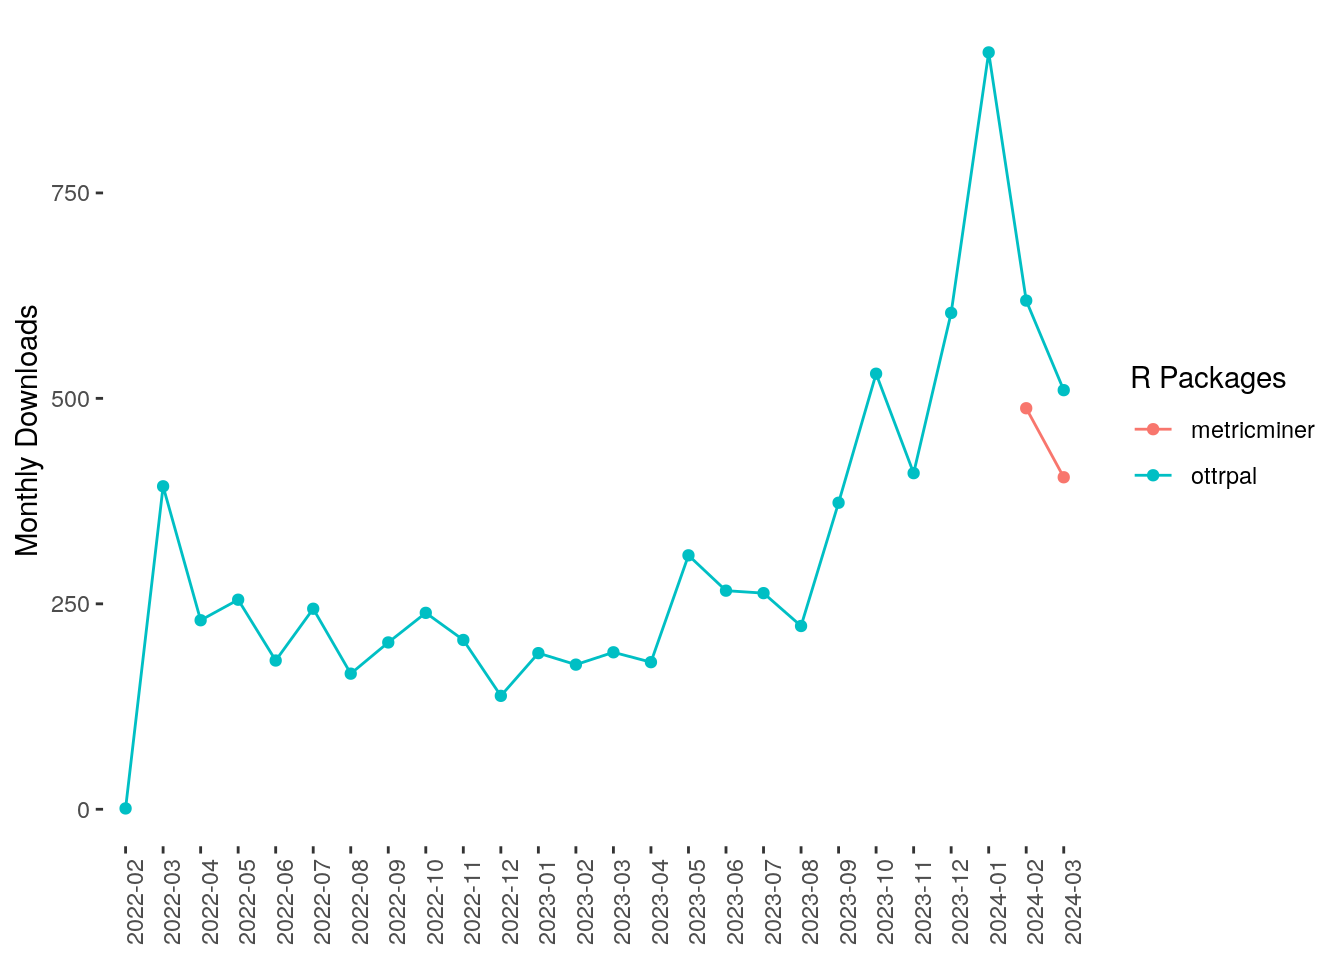
Setting up CRAN
In the _config_automation.yml you will need to specify a
few things.
###### CRAN ######
refresh-cran: yes
cran_packages: [ metricminer, ottrpal ]
cran_googlesheet:Customizing CRAN Data
In order to customize the data you are downloading from CRAN you can
modify the refresh-scripts/refresh-cran.R script in your
repository.
You can take a look at the metricminer
R package documentation for more details about the functions and
what is possible.
If you have a metric need that is not currently fulfilled by
metricminer or metricminer-dashboard we
encourage you to file a
GitHub issue with us and let us know about your new feature idea (or bug
report).