
Chapter 14 Spatial transcriptomics
14.2 What are the goals of spatial transcriptomic analysis?
Spatial transcriptomics (ST) technologies have been developed as a solution to the lack of spatial context in single cell transcriptomics (scRNA-seq) data (Rao et al. 2021; Ospina, Soupir, and Fridley 2023). There is a diversity of ST methods, however all have in common two features: Multiple measurements of gene expression and the locations within the tissue where those gene expression measurements were taken. Data analysis of ST data requires integration of those two components, and it’s primary goal is to characterize gene expression patterns within the tissue or cellular context. The ability to quantify gene expression at different locations within the tissue is of tremendous value to understand the functional variation of different tissue regions, domains, or niches. It also places cell-cell communication in the context of cell neighborhoods, which ultimately facilitates a deeper understanding of cell and tissue biology, but also enables practical applications such as discovery of novel drug targets for complex diseases such as cancer (Dries et al. 2021; Williams et al. 2022). Following, are some of the specific goals that a study using ST could achieve:
- Describe tissue-specific cellular neighborhoods of cell types and cell type sub-populations: Although scRNA-seq continues to be a powerful method to assign biological identities to a mixture of cells, integrated analysis of ST combined with scRNA-seq adds crucial information to cell phenotypes by describing the neighborhoods where cells occur (Longo et al. 2021). Many methods to phenotype ST data are available, with most of them relying on the availability of a curated (scRNA-seq) cell type reference. Once cell identities have been determined, clustering or spatial statistics can be applied to describe the composition of tissue niches or domains. The explosion of ST data has resulted on novel and comprehensive tissue- or disease-specific atlases, not only describing the cell types within organs, but also the functional cell-cell relationships that result from spatial organization (e.g., Guilliams et al. (2022); Wu et al. (2021)).
- Uncover spatially regulated biological processes: With ST data, there comes the ability to detect genes or gene pathways that are expressed in specific areas within tissues (i.e., spatially-restricted expression). Detecting genes with spatially-restricted expression is key to achieve further understanding of specific biological processes, such as tissue gradients, cell differentiation, or signaling pathways. For example, cancer researchers are now able to study signaling pathways restricted to the tumor-stroma interface (Hunter et al. 2021), which could lead to the discovery of mechanisms representing cancer vulnerabilities resulting from interactions between the tumor and stroma cells.
- Investigate cell-cell interactions: From basic to applied tissue biology research, the study of cell-cell interactions is of high interest, especially the interactions that occur via ligand-receptor pairs. The construction of comprehensive databases of ligand-receptor interactions has been possible due the large amounts of single-cell data sets produced by researchers. A major contribution of ST to the study of tissue biology is the addition of the spatial context to previously identified ligand-receptor interactions. Because single-cell RNA-seq requires physical separation of cells, current ligand-receptor databases represent hypotheses which ST can help to address by using models of spatial co-localization, enabling in-situ examination of cell-cell interactions and communication (Raredon et al. 2023; X. Wang, Almet, and Nie 2023).
- Integrate imaging data: Spatial transcriptomics data has enabled direct integration of gene expression measurements with digital images of the same (or adjacent) tissue. Improved molecular description and/or exploration of tissue niches or domains is now possible. One approach consists on differential expression of histopathology annotations done by an expert on tissue images (e.g., Ravi et al. (2022)). The opposite approach is possible, which uses unsupervised clustering of ST data assisted by color/intensity information derived from images. Machine learning for integration of ST and imaging data is an active area of development (e.g., Hu et al. (2021); Xu et al. (2022); Tan et al. (2020)). Furthermore, ST data findings can be qualitatively validated by assessing the approximate location of regions such as immune-infiltrated areas or damaged tissue, often resulting from inspection of fluorescence microscopy.
- Identify biomarkers and drug targets: The use of ST allows the exploration of tissue niche-specific expression patterns and gene pathway analysis. This exploration can lead to generation of hypotheses about potential biomarkers for specific tissue functions or disease states. Furthermore, the molecular interactions predicted using scRNA-seq (e.g., ligand-receptor), can now be put in context of the larger tissue architecture using ST data. The spatial context of these interactions will likely boost the identification of novel drug targets, as well as improved understanding of current therapies (Lyubetskaya et al. 2022; L. Zhang et al. 2022).
14.3 Overview of a spatial transcriptomics workflow
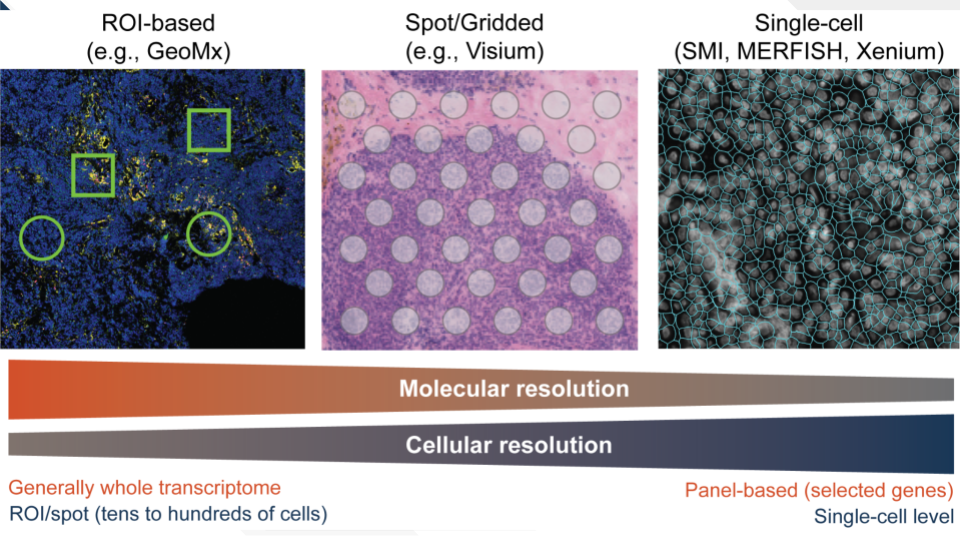
There is a large diversity in approaches to spatially profile tissues. Some ST technologies allow profiling at coarse cellular resolution, where regions of interest (ROIs) are usually identified by a pathologist. These ROIs may include tens of cells up to few hundreds (e.g., GeoMx Bergholtz et al. (2021)). Smaller ROI sizes can be found in other technologies such as Visium, where ROIs of 55uM of diameter (or “spots”) often contain no more than 10 cells (https://www.10xgenomics.com/resources/analysis-guides/integrating-single-cell-and-visium-spatial-gene-expression-data). For finer cellular resolution, technologies such as MERFISH, SMI, or Xenium, among others, can measure gene expression at individual cells (Yue et al. 2023). In general, there is a trade-off between the cellular resolution and molecular resolution, as the number of quantified genes and RNA molecules is lower in single-cell level spatial technologies compared to those at the ROI or spot level. In single-cell ST, often a panel of hundreds of genes is quantified, while in “mini-bulk” (ROI/spot) ST, it is possible to genes at the whole transcriptome level.
In addition to the differences in cellular and molecular, there are fundamental differences in the chemistry used to count the RNA transcripts in the tissue (N. Wang et al. 2021; Yue et al. 2023). Capture or hybridization of RNA followed by sequencing, or fluorescent imaging are two of the most common techniques used in ST methods. Because of large diversity in resolution and chemical procedures among ST technologies, data collection workflows are equally diverse. Finally, each study poses specific questions that cannot be addressed with traditional scRNA-seq pipelines, requiring customized workflows.
Some of the commonalities in the workflows are presented here:
Sample preparation: The preparation of a tissue sample will depend largely on the specific ST technology to be used. In general, this involves obtaining the tissue of interest in the form of a thin slice from a fresh frozen biopsy or a paraffin embedded tissue block. Tissue slices are generally about five to 10 micron of thickness. Given the instability of RNA molecules, the samples originating the tissue slices should be properly preserved and stabilized to maintain the integrity of RNA molecules. Many ST technologies are compatible with tissue microarrays (TMAs).
Capture or hybridization of RNA molecules: In this step, the tissue sample is typically placed on a solid substrate, such as regular positively charged glass slides or vendor-designed slides. The latter category include spatially barcoded slides. (e.g., Visium (Ståhl et al. 2016) ), where RNA capture probes are contained in microscopic spots arranged in arrays or grids. The use of positively charged slides are used in technologies using in-situ sequencing or imaging-based methods, however, capture-based methods like GeoMx also employ this type of slide. Each method entails specific considerations. An example of these considerations include optimization of tissue permeabilization in Visium slides to release the RNA molecules. In the case of imaging-based methods, RNA molecules are hybridized with fluorescent probes that uniquely identify each RNA species [e.g., SMI (S. He et al. 2022), MERFISH (M. Zhang et al. 2021) ].
RNA quantification: The method used to count the number of captured or hybridized RNA molecules greatly varies from technology to technology. Capture methods often involve release of the RNA molecules from the tissue or slide, followed by library preparation, amplification, next generation sequencing, and read mapping to a reference genome. In this case, libraries are spatially multiplexed, whereby barcodes indicate the spatial location originating the captured RNA molecules. In imaging-based methods, segmentation is required to delineate the cell borders. Then, coded fluorescent probes are counted within each segmented cells.
Data quality control and pre-processing: As with any omics technology, filtering and pre-processing is of paramount importance for downstream analysis. Spatial transcriptomics data typically contain an excess of zeroes and high gene dropout (Zhao et al. 2022). Removing genes expressed in very few spots or cells is often done. Similarly, it is advisable to remove spots with very few counts, however, care needs to exercised to not remove biological variation due to cellularity (i.e., areas with fewer cells tend to have less counts). Mitochondrial or ribosomal genes if available in the data, can be used to assess the level of tissue necrosis and filter accordingly (Ospina, Soupir, and Fridley 2023). In imaging-based methods, the area of cells can be used to detect “doublets” generated during image segmentation. Once filtering has been performed, gene count normalization and transformation is typically a part of pre-processing. Commonly used methods in scRNA-seq such as library-size normalization and log-transformation, are also commonplace in spatial transcriptomics studies. Methods that attempt technical effect correction such as SCTransform (Hafemeister and Satija 2019) can be also used.
Visualization: Similar to scRNA-seq data, dimension reduction methods such as the Uniform Manifold Approximation and Projection (UMAP) are key to visualize the heterogeneity of the data set. Nonetheless, given the additional modality provided by the spatial coordinates, spatial gene expression heatmaps can be generated, which can be compared against the imaging data (e.g., H&, IHC, mIF) to gain further insights into overall tissue architecture.
Clustering and cell/tissue domain phenotyping: There is a plethora of clustering approaches, ranging from employed in scRNA-seq analysis (e.g., Louvain) to novel neural network classification. Some methods take advantage of the spatial location information and/or tissue image to inform clustering. Compared to clustering, cell/domain phenotyping is an area of even more active development, within the majority of methods relying on the use of a comprehensive single-cell, tissue specific atlas from which cell types (i.e., “labels”) are obtained. Canonical marker-based phenotyping is still widely used, and in many cases unavoidable to identify specific cell populations. general, it is advisable to use the expert validation of a tissue biologist or pathologist to ascertain if clustering and phenotyping are capturing the tissue architecture adequately.
14.4 Spatial transcriptomic data strengths:
- Preservation of the spatial context: Spatial transcriptomics allows the investigation of gene expression patterns, cell types, and their interactions within the context of tissue spatial organization.
- Integration with imaging data: Spatial transcriptomics provides an additional data modality in the form of imaging data, such as histological images or fluorescence microscopy. This integration enhances the interpretation of spatial transcriptomic data by correlating gene expression patterns with tissue morphology and specific cellular structures.
- Discovery of novel cell-cell interactions and signaling pathways: By examining gene expression profiles in the spatial context, higher accuracy in the identification of novel cell-cell interactions and signaling pathways is obtained. Pairs of interacting genes can be identified by studying their level of co-localization (i.e., expressed in the same regions).
- Exploration of spatially regulated biological processes: Spatial transcriptomics enables the investigation of biological processes, such as spatial expression gradients or developmental processes occurring in specific regions. It provides insights into spatially restricted gene expression patterns associated with tissue patterning, morphogenesis, or cellular differentiation.
- Hypothesis generation and biomarker discovery: Spatial transcriptomic analysis can help in the generation of hypotheses and the identification of potential biomarkers related to specific tissue functions, regions, or disease states. By linking gene expression patterns to tissue organization and pathology, spatial transcriptomics facilitates the discovery of spatially restricted gene signatures and potential diagnostic or prognostic markers.
14.5 Spatial transcriptomic data weaknesses:
- Trade-off between spatial resolution and molecular resolution: Spatial transcriptomic techniques that provide whole transcriptome level information measure expression at the “mini-bulk” level (spots or ROIs), with each mini-bulk sample containing a collection of cells. Conversely, single-cell ST provide expression for a panel of genes (hundreds to a few thousands of genes). In addition, obtaining fine-grained spatial information may be challenging, especially in complex tissues or samples with high cellular density.
- Technical variability and experimental artifacts: Spatial transcriptomic analysis involves multiple experimental steps, including tissue processing, capture/hybridization, and sequencing/imaging. Each step introduces technical variability and potential experimental artifacts, which can impact the accuracy and reproducibility of the results. Controlling and minimizing these sources of variation is crucial but can be challenging.
- Zero excess and limited coverage of transcripts: Since most ST techniques use probes to capture of hybridize RNA transcripts, the resulting data may contain biases in the representation of certain RNA molecules. Additionally, spatial transcriptomic methods may have limitations in capturing certain RNA species or low-abundance transcripts, leading to a large portion of genes not being detected and contribution to zero-count excess.
- Complex Data Analysis: Analyzing spatial transcriptomic data requires advanced computational methods and expertise. The complexity of the data and the need for specialized bioinformatics tools and pipelines can pose challenges, particularly for researchers without extensive computational skills.
- Validation and integration challenges: Spatial transcriptomic analysis generates hypotheses and provides spatially resolved gene expression information. However, validating the functional significance of identified gene expression patterns or cellular interactions may require additional experimentation. Integrating spatial transcriptomic data with other omics data or imaging modalities can also be complex and may require careful data integration strategies.
- Cost and time considerations: Spatial transcriptomic analysis can be relatively expensive and time-consuming compared to traditional transcriptomic techniques. The specialized protocols, reagents, and instrumentation required can add to the cost of the analysis. Moreover, the data generation and analysis processes can be time-intensive, which may limit the scalability of studies involving large sample sizes.
14.6 Tools for spatial transcriptomics
14.6.1 Data processing:
14.6.1.1 Space Ranger
- Pros: Space Ranger is a software package developed by 10x Genomics specifically for processing and analyzing spatial transcriptomics raw data generated by their platform (Visium). It provides a streamlined workflow for processing raw data, including image registration, assignment of read counts to spots, and counting transcripts. Outputs from Space Ranger are commonly the input of many other ST analytical software.
- Cons: Space Ranger has been designed to process only 10x Genomics data. The software does not provide methods to extract insights, which is accomplished by integration with other analytical suites. Requires knowledge of command line use.
14.6.1.2 GeomxTools
- Pros: The GeomxTools R package has been designed to take outputs from the GeoMx Digital Spatial Profiler (DSP) platform. The package includes methods to use raw .dcc files and .pkc probe set files to generate count matrices per ROI. Support for normalization and transformation of counts are also included in GeomxTools.
- Cons: GeomxTools has been designed to process GeoMx DSP data outputs. Requires knowledge of R programming.
14.6.2 Data exploration:
14.6.2.1 Seurat
- Pros: Seurat is a widely used R package in single-cell data, with expanded capabilities to analyze ST data from multiple platforms. Seurat features direct integration with outputs from Space Ranger, MERSCOPE, CosMx-SMI, among others. It provides a variety of functions for data pre-processing, dimensionality reduction, clustering, and visualization. Seurat has a large user community, extensive documentation, and tutorials, making it accessible to researchers.
- Cons: Seurat can be memory-intensive, particularly when working with large data sets. It requires familiarity with R programming and bioinformatics concepts for effective use. Overall, methods in Seurat are the same methods applied to non-spatial scRNA-seq data.
14.6.2.2 Squidpy
- Pros: Scanpy is a Python-based library specifically designed for single-cell and ST analysis. It offers a range of functionalities for data pre-processing, clustering, trajectory analysis, and visualization. Scanpy is known for its scalability, efficiency, and flexibility. It integrates well with other Python libraries and frameworks, making it suitable for integration with other analysis pipelines. Some of the statistical methods in Squidpy implicitly make use of the spatial coordinates to detect patterns.
- Cons: Similar to Seurat, Scanpy requires some familiarity with Python programming and bioinformatics concepts. Users without prior programming experience may need to invest time in learning Python.
14.6.2.3 Giotto
- Pros: The analytical suite Giotto in a collection of methods to study spatial gene expression, agnostic to the platform used to generate the data. It allows users to perform data pre-processing, clustering, visualization, detection of spatially variable genes, and expression co-localization analysis. Computationally intensive analysis can be conducted in the cloud via integration with Terra.bio or locally using a Docker container. Some of the statistical methods in Giotto implicitly make use of the spatial coordinates to detect patterns.
- Cons: Requires some familiarity with R, as well as bioinformatics and spatial statistics concepts. Installation requires setting up Python, as some modules use that language.
14.6.2.4 spatialGE and spatialGE-web
- Pros: The spatialGE analysis suite allows users to study STdata form multiple platforms, including methods for pre-processing, clustering/domain detection, spatially variable genes, and functional analysis via detection of gene expression gradients and/or gene set enrichment spatial patterns. All the functionality of the R package has been implemented on a point-and-click web application requiring no coding experience and email notifications when analyses are completed. Statistcial methods in spatialGE implicitly take into account the spatial coordinates during calculations.
- Cons: Use of the spatialGE R package requires familiarity with the language. The spatialGE web application by-pass the need of R coding, however computationally-intensive methods can take time to complete.
14.6.2.5 Loupe
- Pros: The Loupe browser is a point-and-click tool for exploration of both non-spatial scRNA-seq and ST. Loupe takes Visium outputs and allows visualization of gene expression, clustering, and detection of differentially expressed genes. The tool also allows for easy registration and comparative analysis of Visium imaging and expression data.
- Cons: Loupe allows basic exploration of the data. To perform functional-level analysis of ST data, the use of additional tools might be required.
14.6.2.6 ST Pipeline
- Pros: ST Pipeline is a bioinformatics pipeline developed by the Spatial Transcriptomics consortium. It provides a complete workflow for ST data analysis, including pre-processing, normalization, spot detection, and visualization. ST Pipeline supports various spatial transcriptomic platforms, making it versatile.
- Cons: ST Pipeline requires familiarity with Python, command-line, and Linux environments. Users may need to invest time in setting up the pipeline and configuring parameters based on their specific datasets and platforms.
14.6.2.7 semla
- Pros: The semla R package is a bioinformatics pipeline enabling pre-processing, visualization, spatial statistics, and image integration of ST data. The package provides integration with Seurat.
- Cons: ST Pipeline requires familiarity with R.
14.6.3 Clustering/tissue domain identification:
14.6.3.1 SpaGCN
- Pros: The SpaGCN Python package performs prediction of tissue domains implicitly taking into account the spatial coordinates and optionally assisted by colors in the image data. The gene expression, coordinate, and image data are processed via graph convolutional networks (GCN) to find common patterns between the modalities. Based on predicted domains, SpaGCN can identify gene or collection of genes (meta genes) that are uniquely expressed in the domains. SpaGCN allows analysis of multiple ST technologies.
- Cons: SpaGCN requires familiarity with Python and basic data frame processing. Some understanding of GCNs and parameters involved in calculations is advisable.
14.6.4 Spatially variable gene identification:
14.6.4.1 SpatialDE
- Pros: SpatialDE is a Python package designed for detecting spatially variable genes from ST data using non-parametric statistics. SpatialDE intergrates the spatial coordinates and image data to identify genes or group of genes showing spatial expression aggregation. The package can analyze data from multiple ST platforms.
- Cons: SpatialDE requires familiarity with Python programming.
14.6.4.2 SPARK and SPARK-X
- Pros: The SPARK methods allows scalable detection of genes showing spatial patterns. The tests are performed via generalized linear models and spatial autocorrelation matrix estimation. The SPARK implementation allows scalabilty and computing efficiency.
- Cons: The SPARK methods require familiarity with Python programming. Some familiarity with spatial statistics is advisable.
14.6.4.3 SpaceMarkers
- Pros: The SpaceMarkers approach detects sets of genes with evidence of spatial co-expression. Kernel smoothing is used to model the weight of expression of a gene taking into account neighboring areas.
- Cons: Requires familiarity with R programming. The method has been tested in Visium data.
14.6.5 Deconvolution/phenotyping:
14.6.5.1 SPOTlight
- Pros: The SPOTlight algorithm takes advantage of robust non-negative matrix factorization (NMF) to define transcriptomic profiles from an annotated scRNA-seq reference. The transcriptomic profiles are transferred to the spatial transcriptomics data using non-negative least squares regression. Instead of providing a single category for “mini-bulk” data (e.g., Visium), SPOTlight features piecharts to describe the cell type composition within each mini-bulk sample (e.g., spot).
- Cons: Requires some familiarity with R programming. The method has been tested in Visium data. As with most deconvolution methods, accurate identification of cell types highly relies on a well-annotated scRNA reference.
14.6.5.2 STdeconvolve
- Pros: The STdeconvolve algorithm uses latent dirichlet allocation (LDA) to define transcriptomic profiles or topics on the ST data. The topics are assigned a biological identity (e.g., cell type, tissue domain) using gene set enrichment of marker-based phenotyping. The topics are presented as proportions in “mini-bulk” data (e.g., Visium), where pie charts describe the cell type/domain composition within each mini-bulk sample (e.g., spot). STdeconvolve is one of very few reference-free ST deconvolution methods.
- Cons: Requires some familiarity with R programming. The method has been mostly tested in Visium data. For MERFISH data, requires aggregation into spots.
14.6.5.3 InSituType
- Pros: InSituType is a cell phenotyping algorithm designed for CosMx-SMI data but applicable to other single-cell ST data. InSituType can transfer cell types from an annotated scRNA-seq data set, or run reference-free unsupervised clustering to detect cell populations. In addition, immunofluorescence data accompanying SMI data sets can be used to inform gene expression deconvolution. InSituType can phenotype large quantities of cells within reasonable time.
- Cons: InSituType assumes cell populations can be defined via cluster centroids. Thus, deconvolution can be affected when samples contain cells with intermediate phenotypes or if technical/background noise is prevalent. Requires familiarity with R programming.
14.6.5.4 SpatialDecon
- Pros: The SpatialDecon algorithm implements log-normal regression to alleviate the effects of ST data skewness in the prediction of cell types. The method is analogous to estimation of cell types proportions in bulk RNAseq to “mini-bulk” ROIs or spots in GeoMx and Visium experiments respectively. Hence, the method assumes cell type heterogeneity within the ROIs or spots. In the case of GeoMx experiments, SpatialDecon takes advantage of nuclei counts to provide absolute cell type counts within each ROI. The package includes pre-built cell type signature matrices for several tissue types, but scRNA references can be used to create custom signatures.
- Cons: Requires familiarity with R programming.
14.6.6 Cell communication:
14.6.6.1 CellChat
- Pros: CellChat is an algorithm to infer cell communications via ligand-receptor interactions. CellChat was designed for non-spatial scRNA data, however, a recent implementation has been included to account for distances between cells in ST experiments. The package includes a comprehensive ligand-receptor data base which is queried after quantification of probability of interaction between two given cell types.
- Cons: Requires familiarity with R programming. The spatial implementation of CellChat has been tested on Visium data.