Instructions
- Join a group.
- Makes groups of 2-3 people
- Join a breakout room with your group.
- Pick at least one plot from this list (also listed below). Note there is a mixture of common plot types (Violin plot, boxplot, stacked bar chart, Heatmap) and field specific plots (e.g., Caterpillar plot, Waterfall plot, Quilt plot) listed.
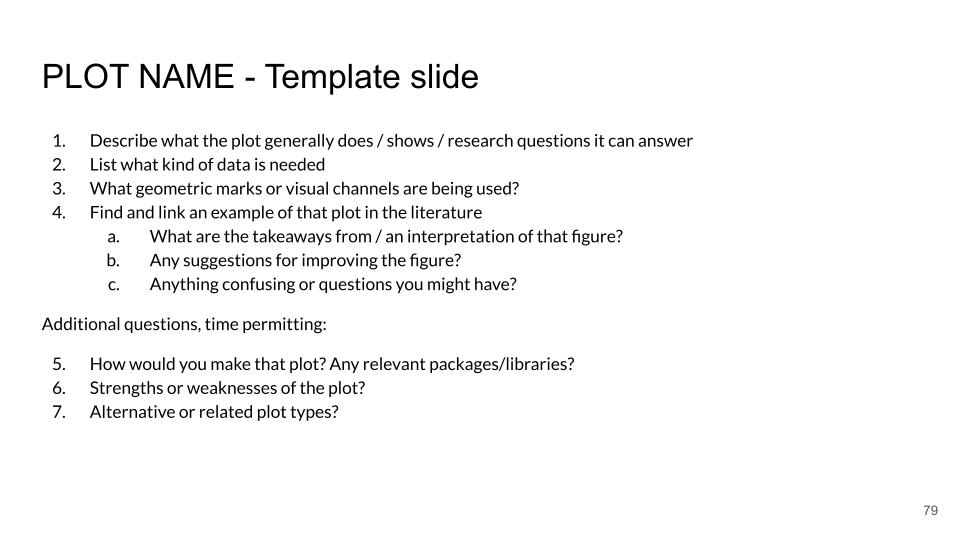
- Research the plot type – answering specific questions listed on the template slide
- Add answers to this slide deck
- Navigate to your group’s slide and edit that slide
- Add additional slides as needed
Plot types to choose from
- Violin plot
- Boxplot
- Ridgeline plot
- Raincloud plot
- Stacked bar chart
- Grouped bar chart
- Lollipop Chart
- Dumbbell plot
- Strip plot
- Swarm plot
- Heatmap
- Parallel plot
- Quilt Plot
- Bubble Plot
- Confusion Matrix
- ROC curve
- Precision - Recall curve
- Venn Diagram
- Upset Plot
- Sankey Diagram
- Waterfall plot
- Forest plot
- Caterpillar plot
- Kaplan-Meier Curve
- Cumulative incidence curve
- Volcano Plot
- Manhattan Plot
- Rainfall Plot
- Dot plot
- QQ plot
- Repeated Measures Plot
- Spider Plot
- Spaghetti Plot
- Swimmer Plot
- Enrichment Plot
- MA Diagram
- Dimensionality Reduction plots (e.g., PCA, t-SNE, or UMAP)
- Circos Plot
- Biomedical Knowledge Graph
- Sequence Logo Plot
- Footprint Plot
- Tornado Diagram
- Tree Diagram and Dendrogram
- Treemap