candy_data <- read.csv("~/Downloads/candy_wrangled_data_forR.csv")Building an Expository Graph Activity
Pre-requisites and needs
Participants will want to have downloaded the data and have access to R and RStudio (or an equivalent integrated development environment for R).
Data
Wrangled Data for R
The wrangled data can be downloaded from here: https://github.com/fhdsl/decode_dataviz_workshop/blob/main/resources/activity_data/candy_wrangled_data_forR.csv
Loading into R
Example of how to load into R (assuming the file is in your Downloads folder):
Verifying the data
colnames(candy_data)[1] “column_name” “Not.Answered” “DESPAIR” “JOY” “MEH” “Chocolate”
dim(candy_data)[1] 76 6
This shows that the data has 76 rows (76 different candies) and 6 columns.
Full Dataset (not wrangled)
The full dataset is available here: https://www.scq.ubc.ca/so-much-candy-data-seriously/ and can be downloaded as a csv file.
Description of data
This data is from a 2017 survey for likely trick or treaters. Participants were asked demographic questions such as their gender, their age, and their place of residence. In addition, they were provided a list of different candy types and asked how they feel when they receive each of those candies.
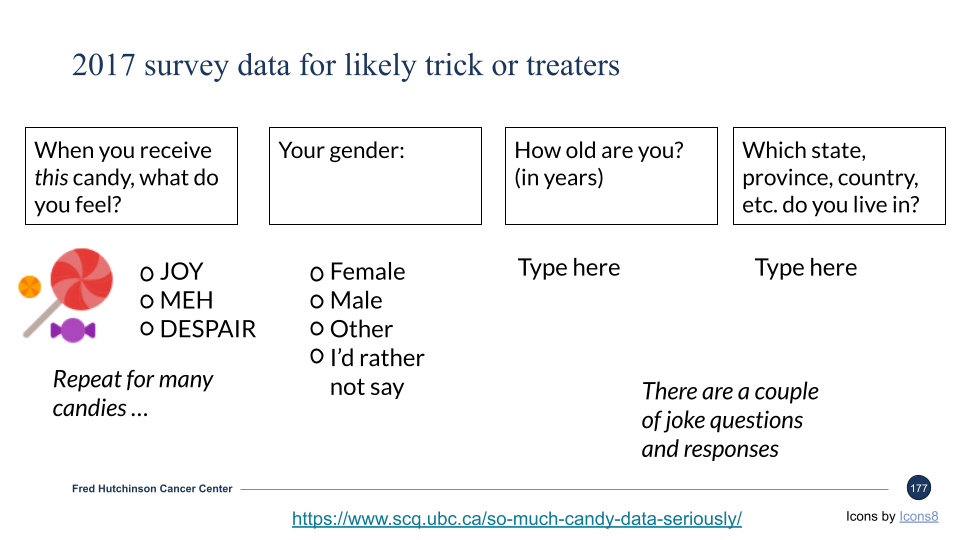
The wrangled data has each candy in a separate row with columns such as the proportion of responses that reported Joy, the proportion of responses that reported despair, and whether that candy is chocolate or not is another column. (There may be a few other columns).
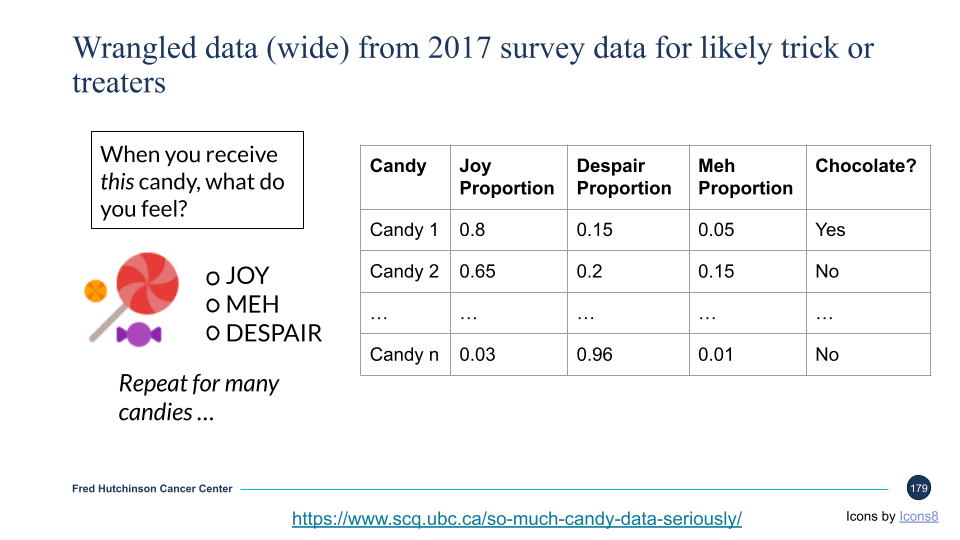
Column names for R data
- “column_name”: The name of the candy
- “Not.Answered”: The proportion of respondents who didn’t answer the question for that candy (continuous numerical data bounded between 0 and 1)
- “DESPAIR”: The proportion of respondents who reported feelings of despair for that candy (continuous numerical data bounded between 0 and 1)
- “JOY”: The proportion of respondents who reported feelings of joy for that candy (continuous numerical data bounded between 0 and 1)
- “MEH”: The proportion of respondents who reported feelings of indifference for that candy (continuous numerical data bounded between 0 and 1)
- “Chocolate”: Whether or not that candy is chocolate (categorical “Yes” or “No”)
The wrangled datasets doesn’t include the gender, age, or residence information. You would have to use the larger source data to look at any of those variables.
Activity description
We will briefly explore the dataset together and then begin to build / polish an expository visualization.